Bitcoin Report - April 2024
Posted on 16/04/2024 | 807 Views
Today our Independent Research Analyst, Isaac Ho from the Ainslie Research Team, brings you the latest monthly deep dive specifically on Bitcoin – including rket analysis, on-chain metrics, sentiment, and technical analysis. He highlights some of the key charts that were discussed and analysed by our expert panel in the latest Beyond the Block episode, but also expands upon his work with some additional insights. We encourage you to watch the video of the original presentation if you haven’t already.
Bitcoin Market Analysis/on-chain
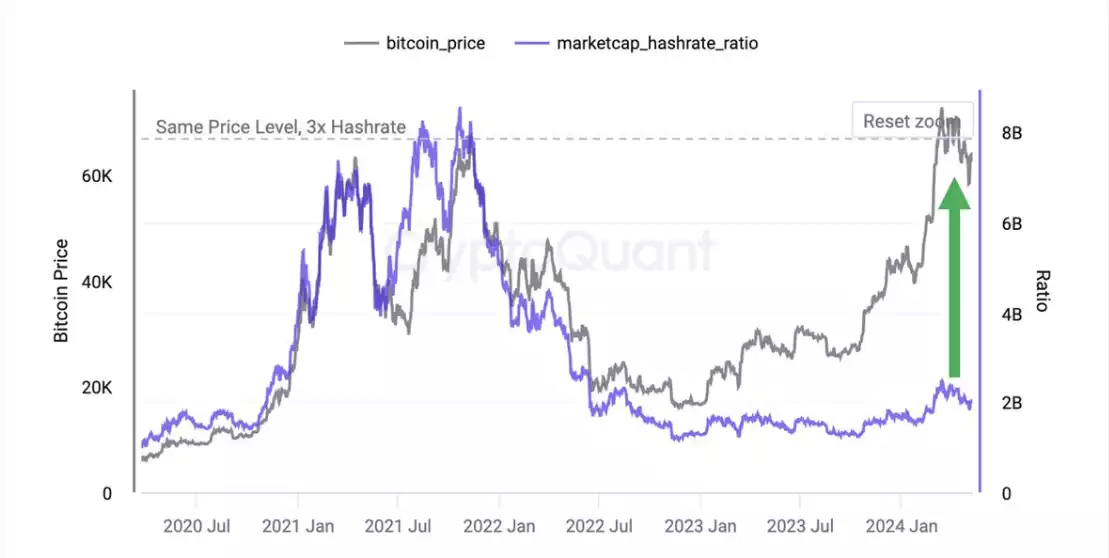
Since last month's update, the deviation score has slightly decreased as the realized price is gradually increasing in comparison to the market price. This can be seen as a positive development, as the average traded BTC is rising, thereby establishing a new base for the average cost basis. The macro thesis that was discussed last month continues to hold, anticipating a deviation of at least 5-6 during the later months of the macro summer/mid-cycle. Now, with the halving event taking place this coming weekend, we can expect some volatility, potentially leading to a further decline in price, temporarily lowering our Z-score, and resembling the 2019 era. However, there is currently no indication that any of this price action is detrimental when considering the long-term perspective.
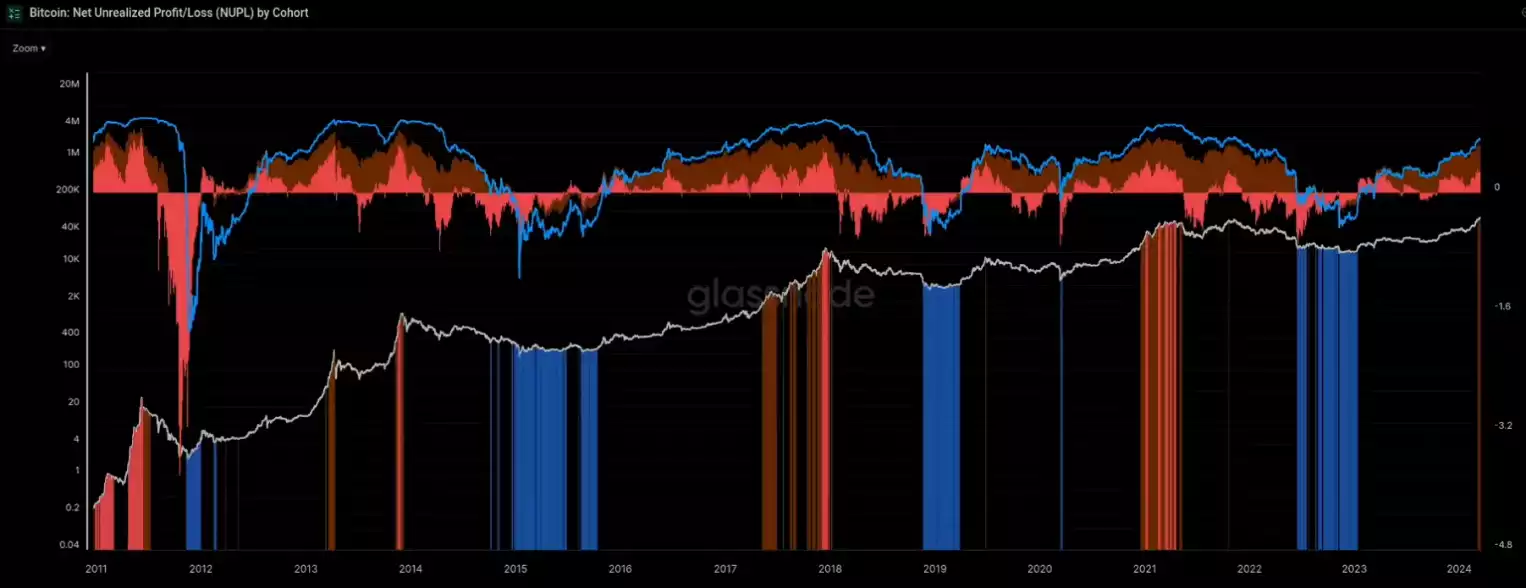
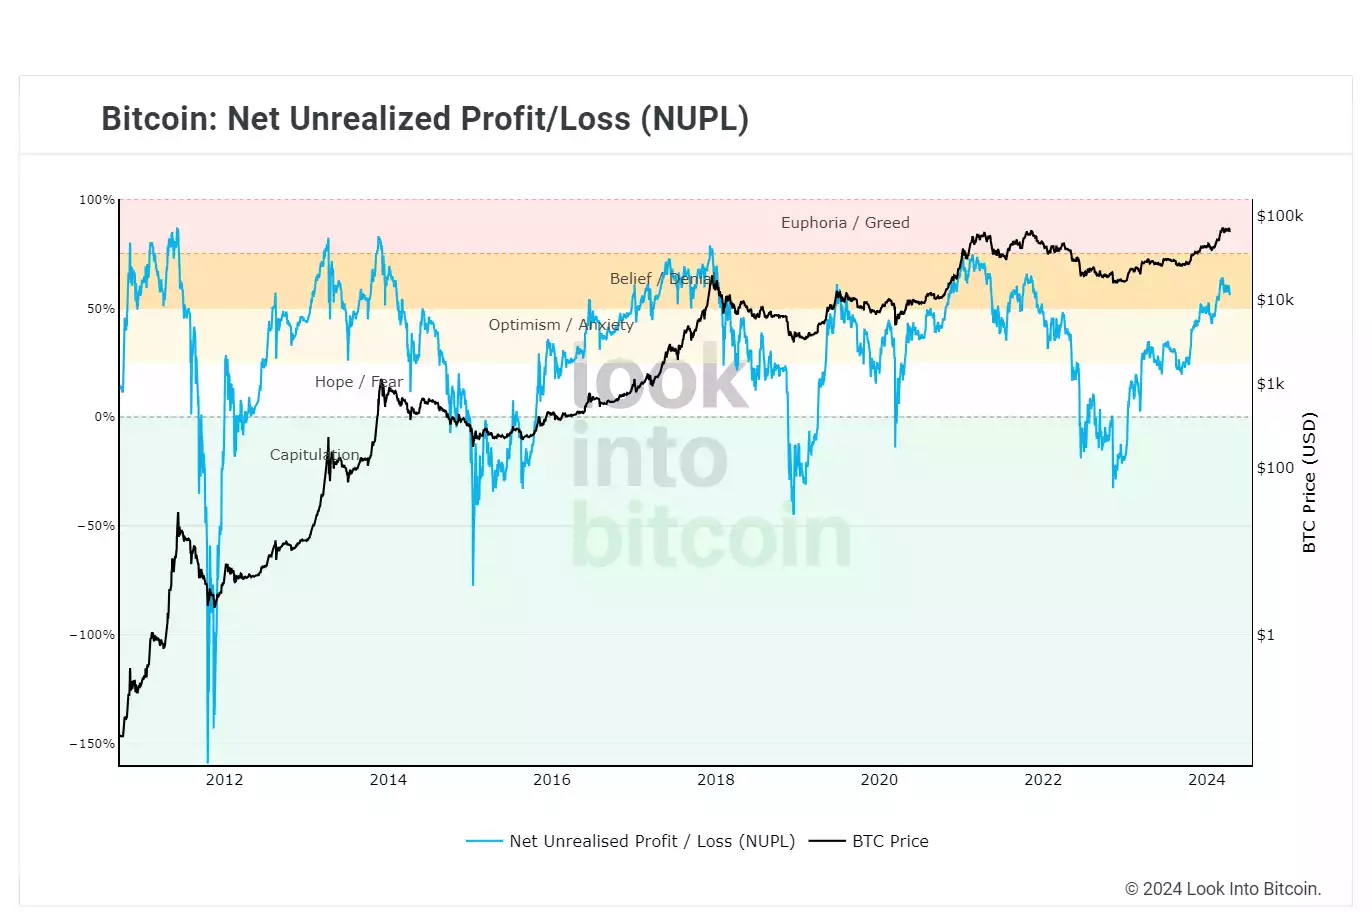
The NUPL chart, which stands for Net Unrealized Profit/Loss, shows whether most Bitcoin holders are in profit or loss. At present, we are noticing the formation of red euphoric bands. These bands have appeared and disappeared in previous cycles and are considered a reliable biasing tool, typically lasting between 6 months to a year. If we see an unusually rapid rise from this point, it could support the theory of a left-translated cycle for this Bitcoin cycle. Nevertheless, as of now, we remain consistent with the standard 4-year cycle pattern.
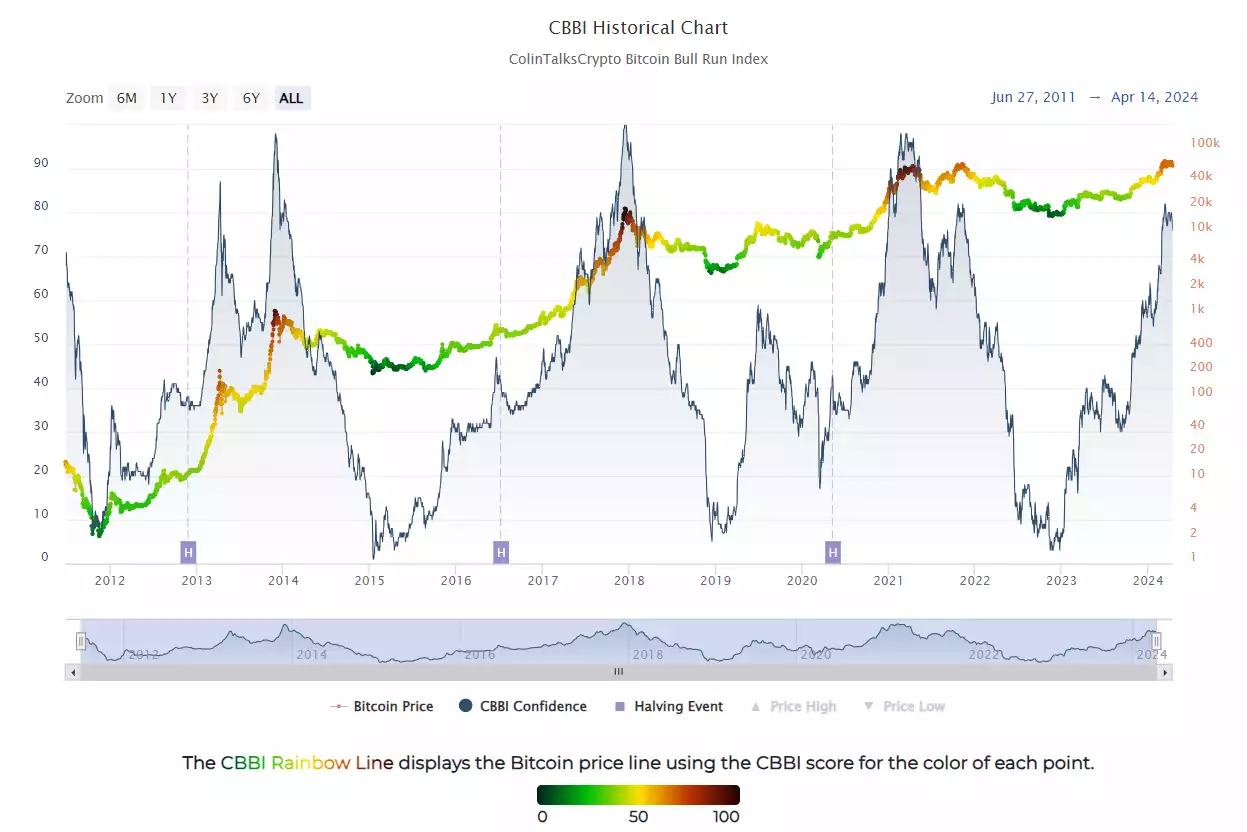
The conglomeration chart seems to be indicating a potential local top beginning to roll over slightly. At its peak, it reached 85, indicating high levels but not quite suggesting a top. Visually, the chart has not yet reached euphoric levels. It's worth noting that euphoria can manifest in various forms, including fear. Given the current global events, Bitcoin could be perceived as a safe haven during uncertain times. However, the key factor is how the general public interprets and reacts to this narrative.
Bitcoin Cycles
From a cyclical perspective, we have deviated from the typical cycle by surpassing the all-time high pre-halving, a first in Bitcoin's history. This unprecedented event has sparked various theories among investors about what to expect next. Determining the contrarian play is difficult at this stage, as discussions are split between the normal cycle playing out and the possibility of a left-translated cycle. Given that we are still in the early stages of the cycle, it's too soon to confidently predict what will happen. However, one certainty is that we are approaching the halving, and historical data suggests this period is typically characterized by significant growth. Thus, regardless of differing theories, higher prices are anticipated in the future.

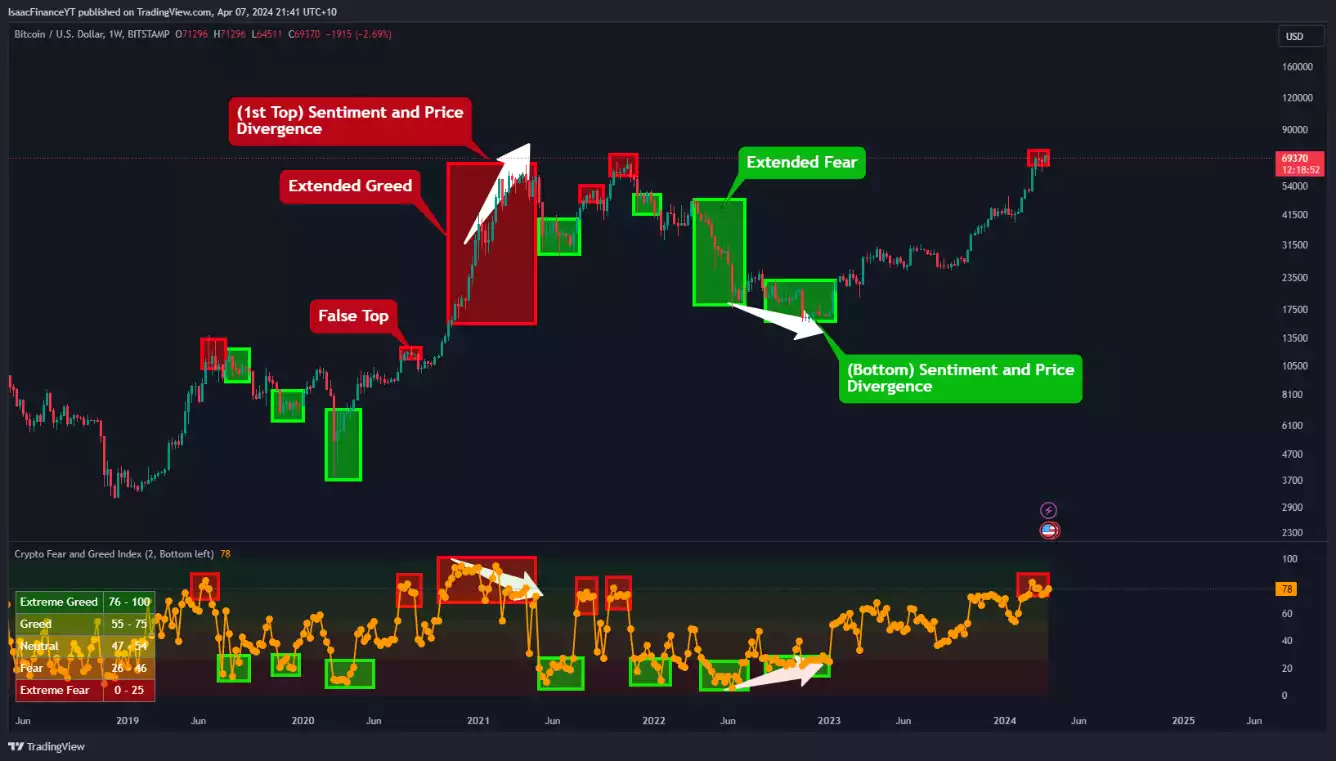
Market Sentiment
The Fear and Greed Index has remained elevated for an extended period, but this does not necessarily indicate bearish conditions. In the past, false top signals have been observed when the metric reached an index of 90+. Over the past few weeks, we have hit a 91 index, followed by a pullback or consolidation in price. This pattern is not surprising, as it is not sustainable to remain in those high regions for a prolonged period, especially considering the halving event has not yet occurred. An intriguing observation is the divergence between price and index scores at both the tops and bottoms, for example where the price increases while the Fear and Greed Index begins to decrease. I will be monitoring this divergence closely as we approach the tops of this bull run; however, this pattern might not hold if a blow-off top occurs.
In the short-term, sentiment appears quite volatile, with investors frequently changing their positions. This fluctuation is primarily driven by war-related fears. Despite these factors, the halving period is typically characterised by heightened emotions, and many anticipate significant upward price movements. However, when these expectations are not immediately met, people tend to exit their positions, resulting in minor downturns along the path to new all-time highs. Similar to the anticipation surrounding the ETFs, there was considerable hype leading up to the release, but a subsequent decline followed as the actual outcome did not align with expectations. This process effectively eliminates weak hands, ultimately benefiting the market in the long run, regardless of the short-term fluctuations.

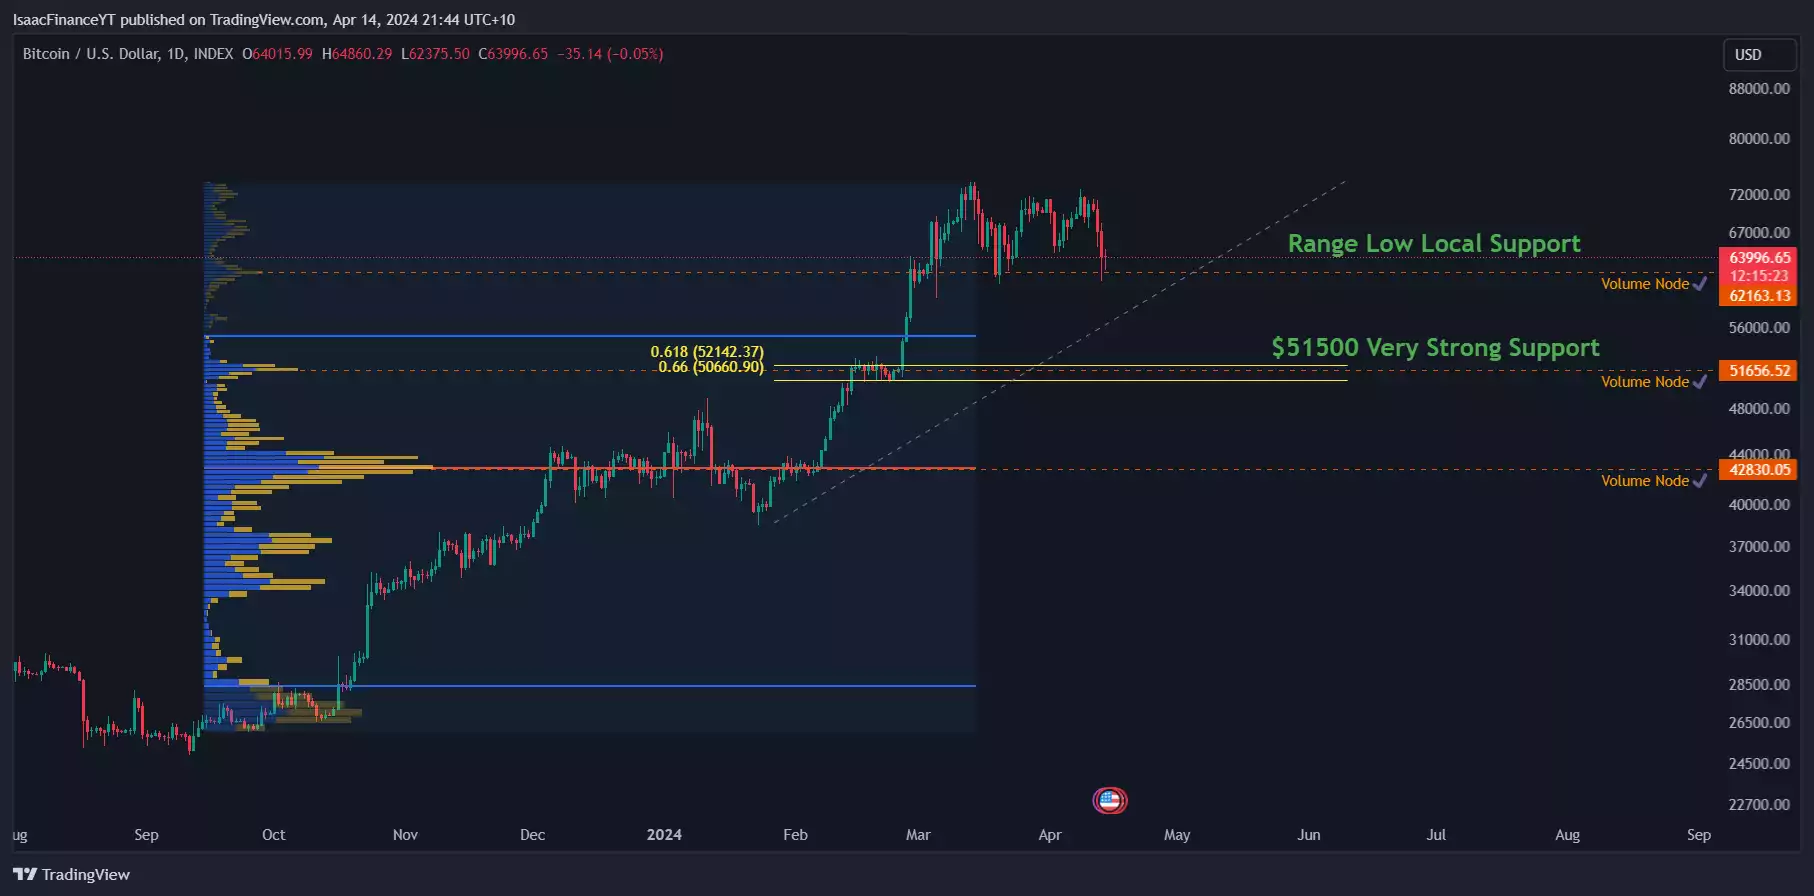
Technical Analysis
From a technical perspective, we observe strong local support at the 62k region. Further down, at 52k, there is additional support from volume and Fibonacci levels, making a move to these levels possible, though it seems less likely given the current price action in response to WW3 fears.
Additionally, a bull flag is starting to form, which is generally positive for price. In the long term, extended periods of consolidation, like this, are beneficial as they decrease the probability of a left-translated cycle.
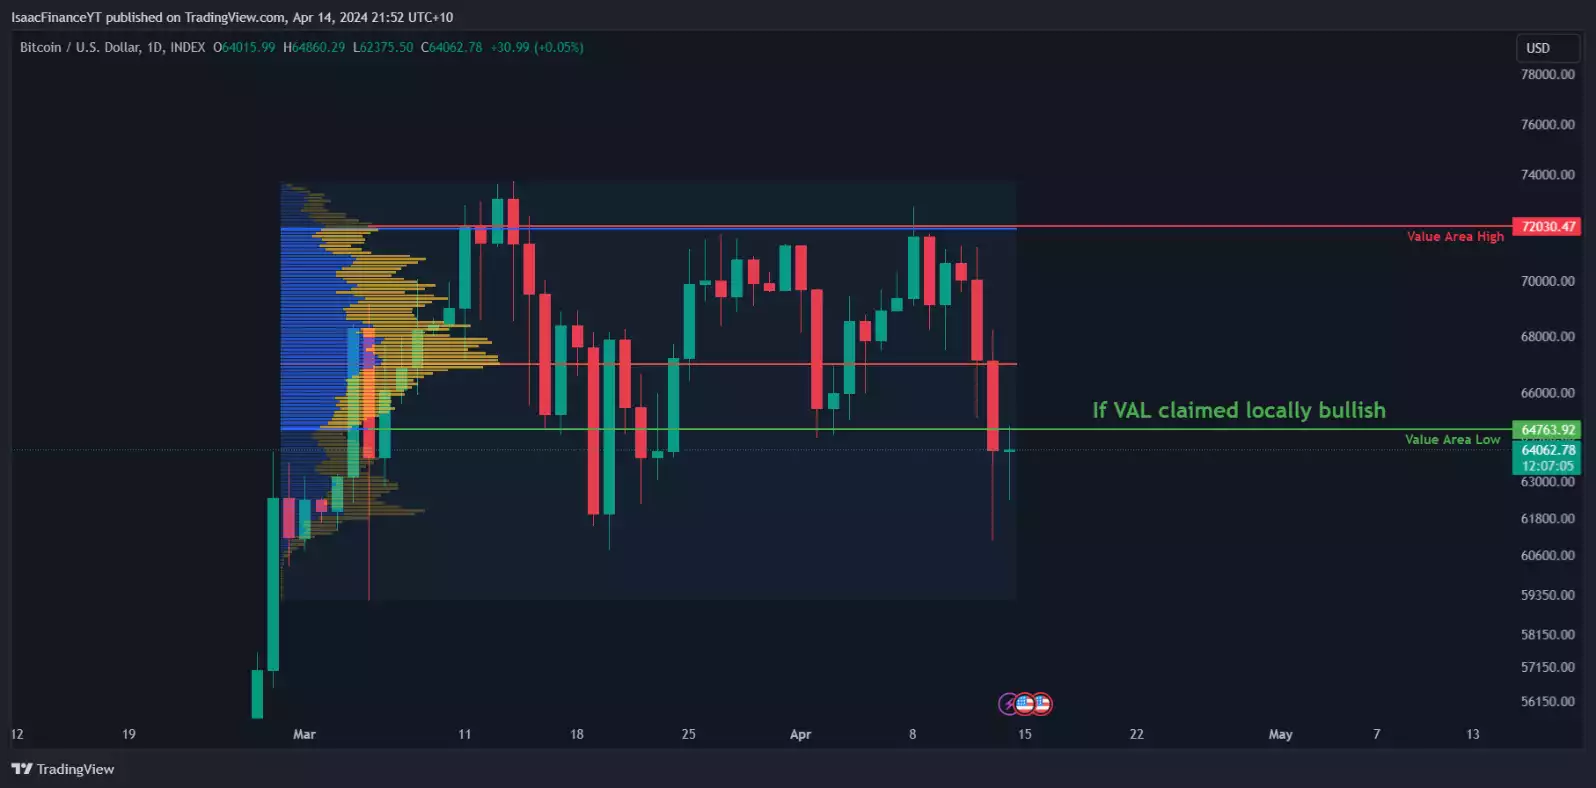
On the daily timeframe, I am monitoring for a break above the Value Area Low, which would increase the likelihood of reaching the Value Area High to around 80%. A key price point to watch is the Point of Control, which represents a high-volume node and could present some resistance. From a trading perspective, initiating a long position here appears technically sound; however, a clear invalidation point would be necessary, which, in my view, would be a move towards the current candle's low.
Regarding liquidity regions, there are notable concentrations of short positions above the 72k level, while a significant amount of liquidity to the downside is found at the 51k region. This wide range allows price to move without triggering a short squeeze or long liquidation cascade. As a result, I am maintaining a neutral stance as we approach the halving, anticipating a similar pattern to past cycles. After the halving, I will reassess my bias based on the price action and relevant metrics.

Watch the most recent video presentation of Bitcoin Analysis: Beyond the Block where I share some of these explanations in a panel format, and join the discussion on our YouTube Channel here.
I will return with more detailed analysis of everything Bitcoin next month, including more market analysis, on-chain metrics, sentiment, and technical analysis…
Isaac Ho | Independent Research Analyst
The Ainslie Group
x.com/IsaacsDevCorner