Bitcoin Analysis: Beyond the Block - April 2024
Posted on 11/04/2024 | 567 Views
Today the Ainslie Research team brings you the latest monthly update on Bitcoin – including the Macro fundamentals, market and on-chain technical metrics and all of the other factors currently driving its adoption and price. This summary highlights some of the key charts that were discussed and analysed by our expert panel. We encourage you to watch the video of the presentation in full for the detailed explanations.
Bitcoin and Global Liquidity
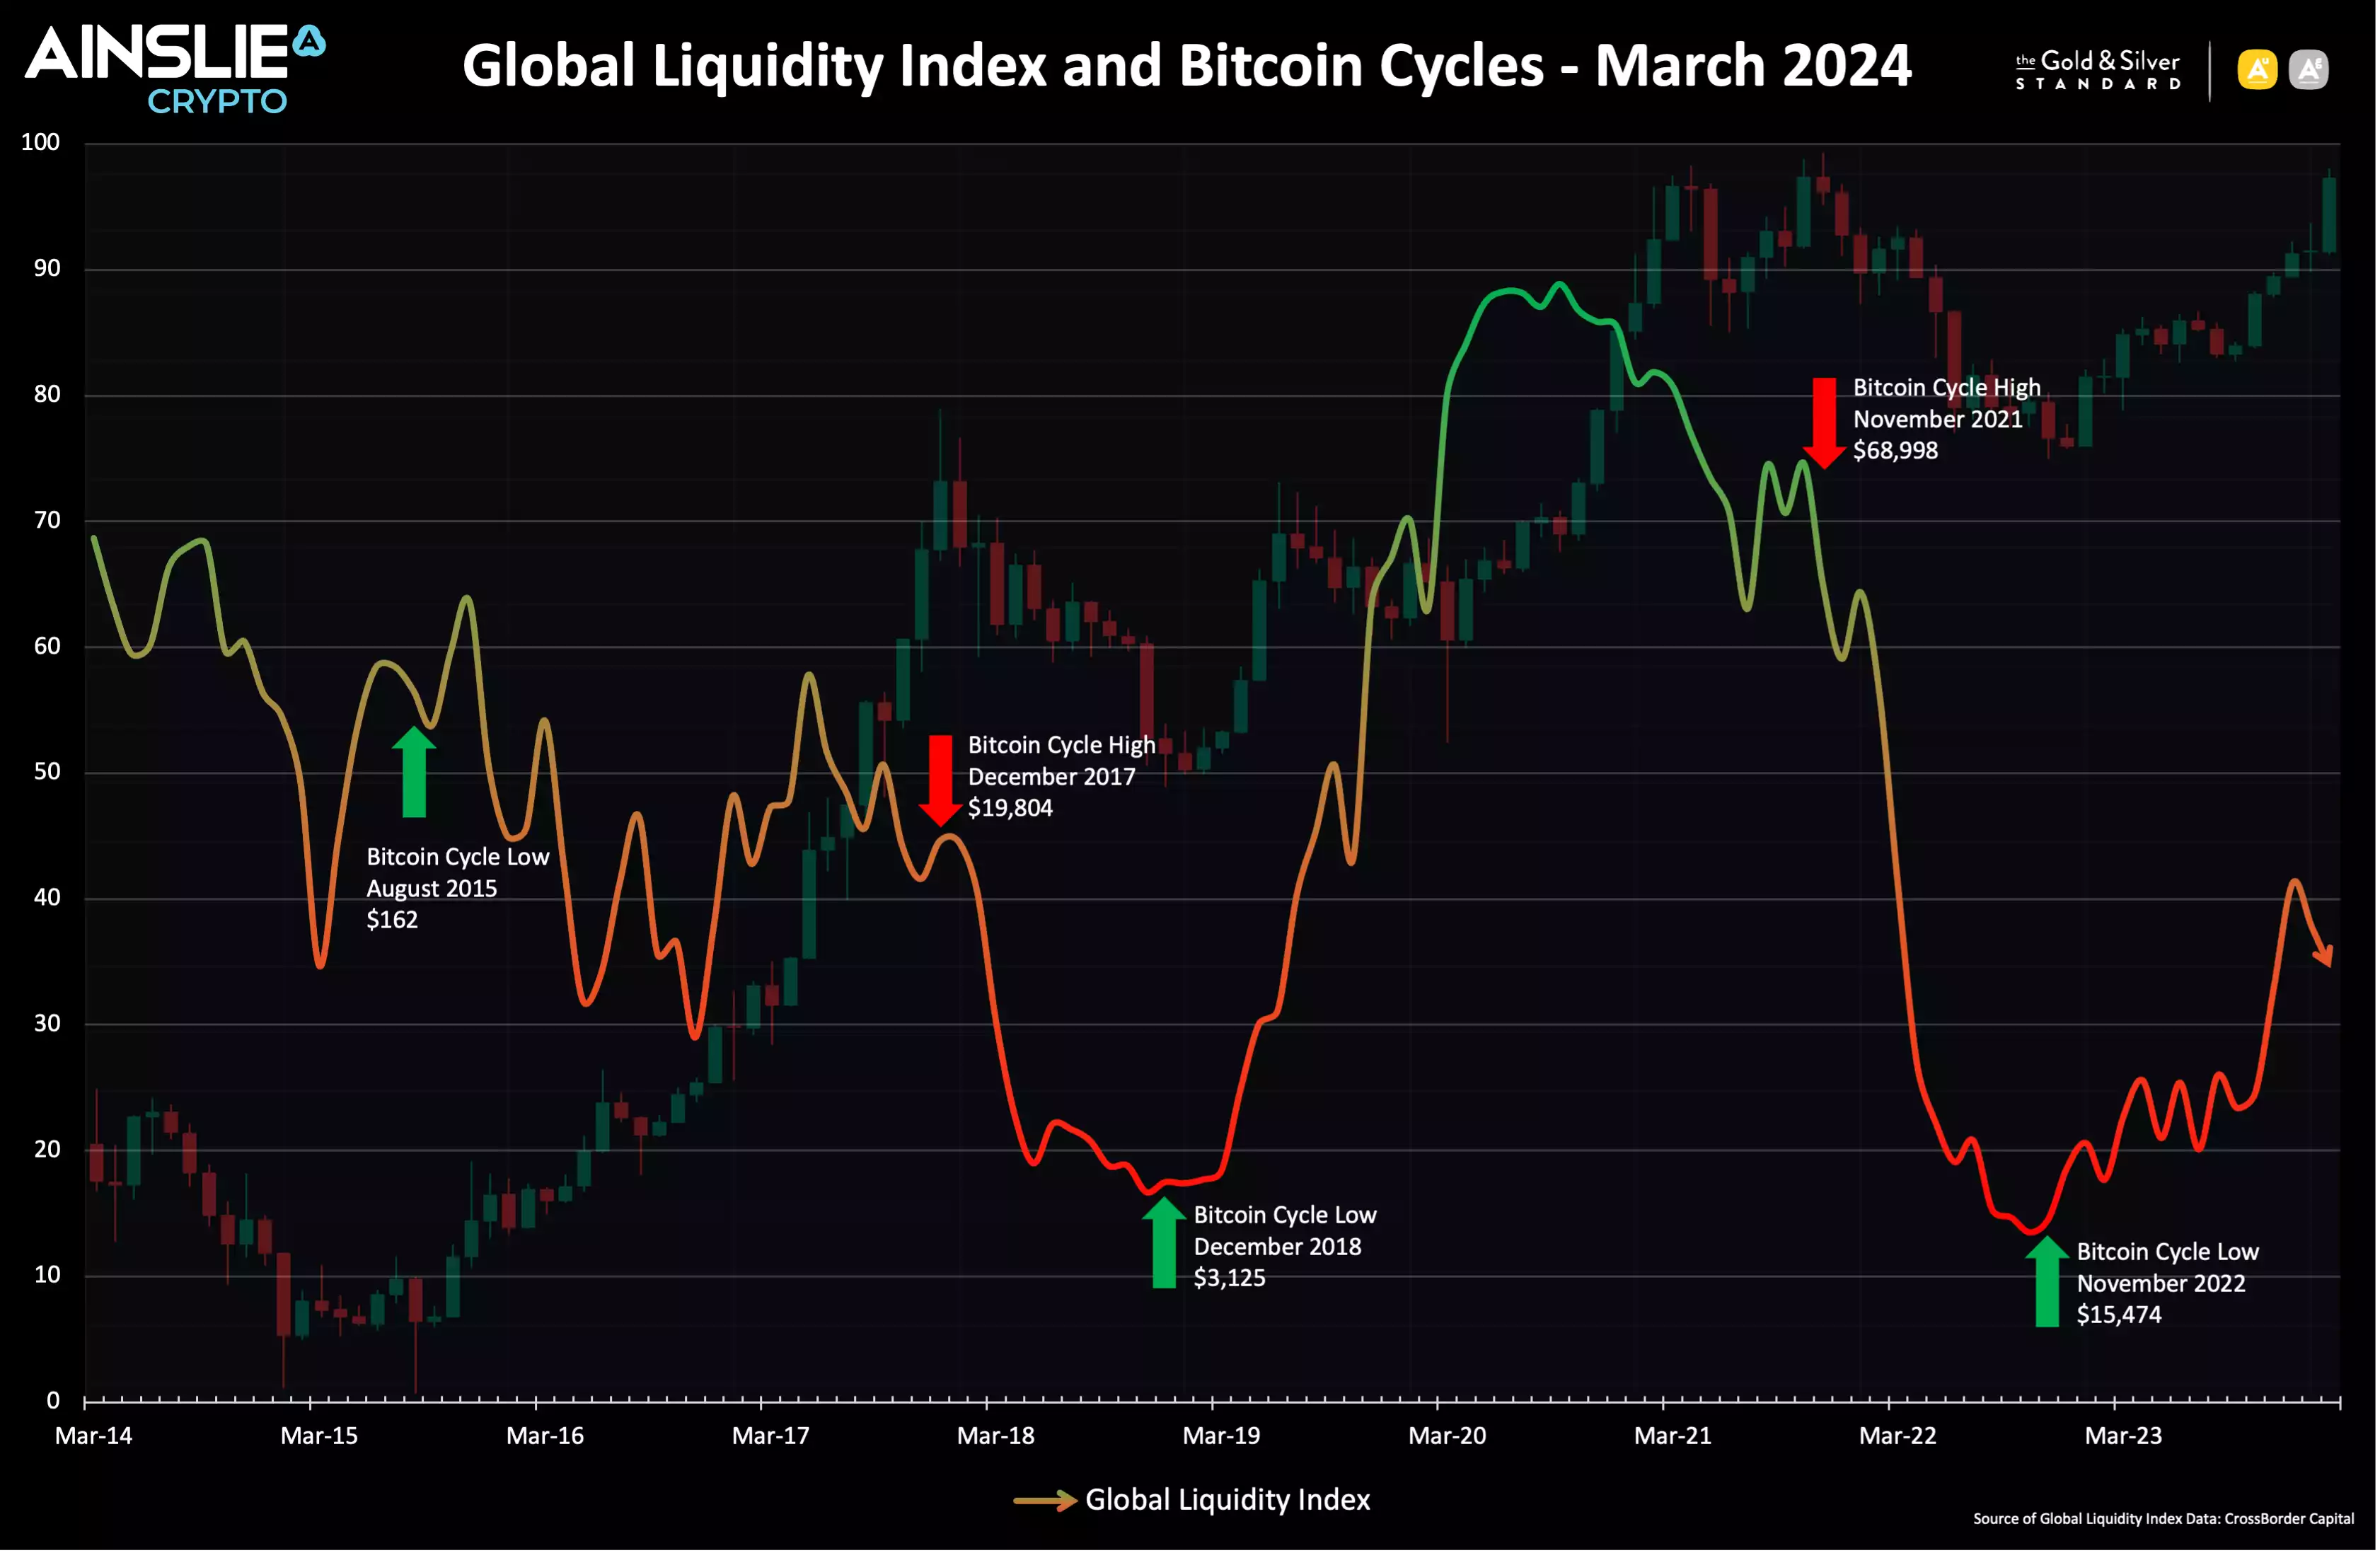
Bitcoin is the most directly correlated asset to Global Liquidity. Trading Bitcoin can be thought of as trading the Global Liquidity Cycle, but with an adoption curve that leads to significantly higher highs and lows each cycle. As such we look to buy Bitcoin during the ‘Bust’ phase or liquidity low, then rotate out of it during ‘Late Cycle’ where liquidity is over extended and downside protection is required (our preference is to rotate into Gold). When correctly timing and structuring the rotation, it is possible to significantly outperform ongoing monetary debasement. The Bitcoin cycle low was in November 2022, and since then the returns have been unmatched by any other major asset.
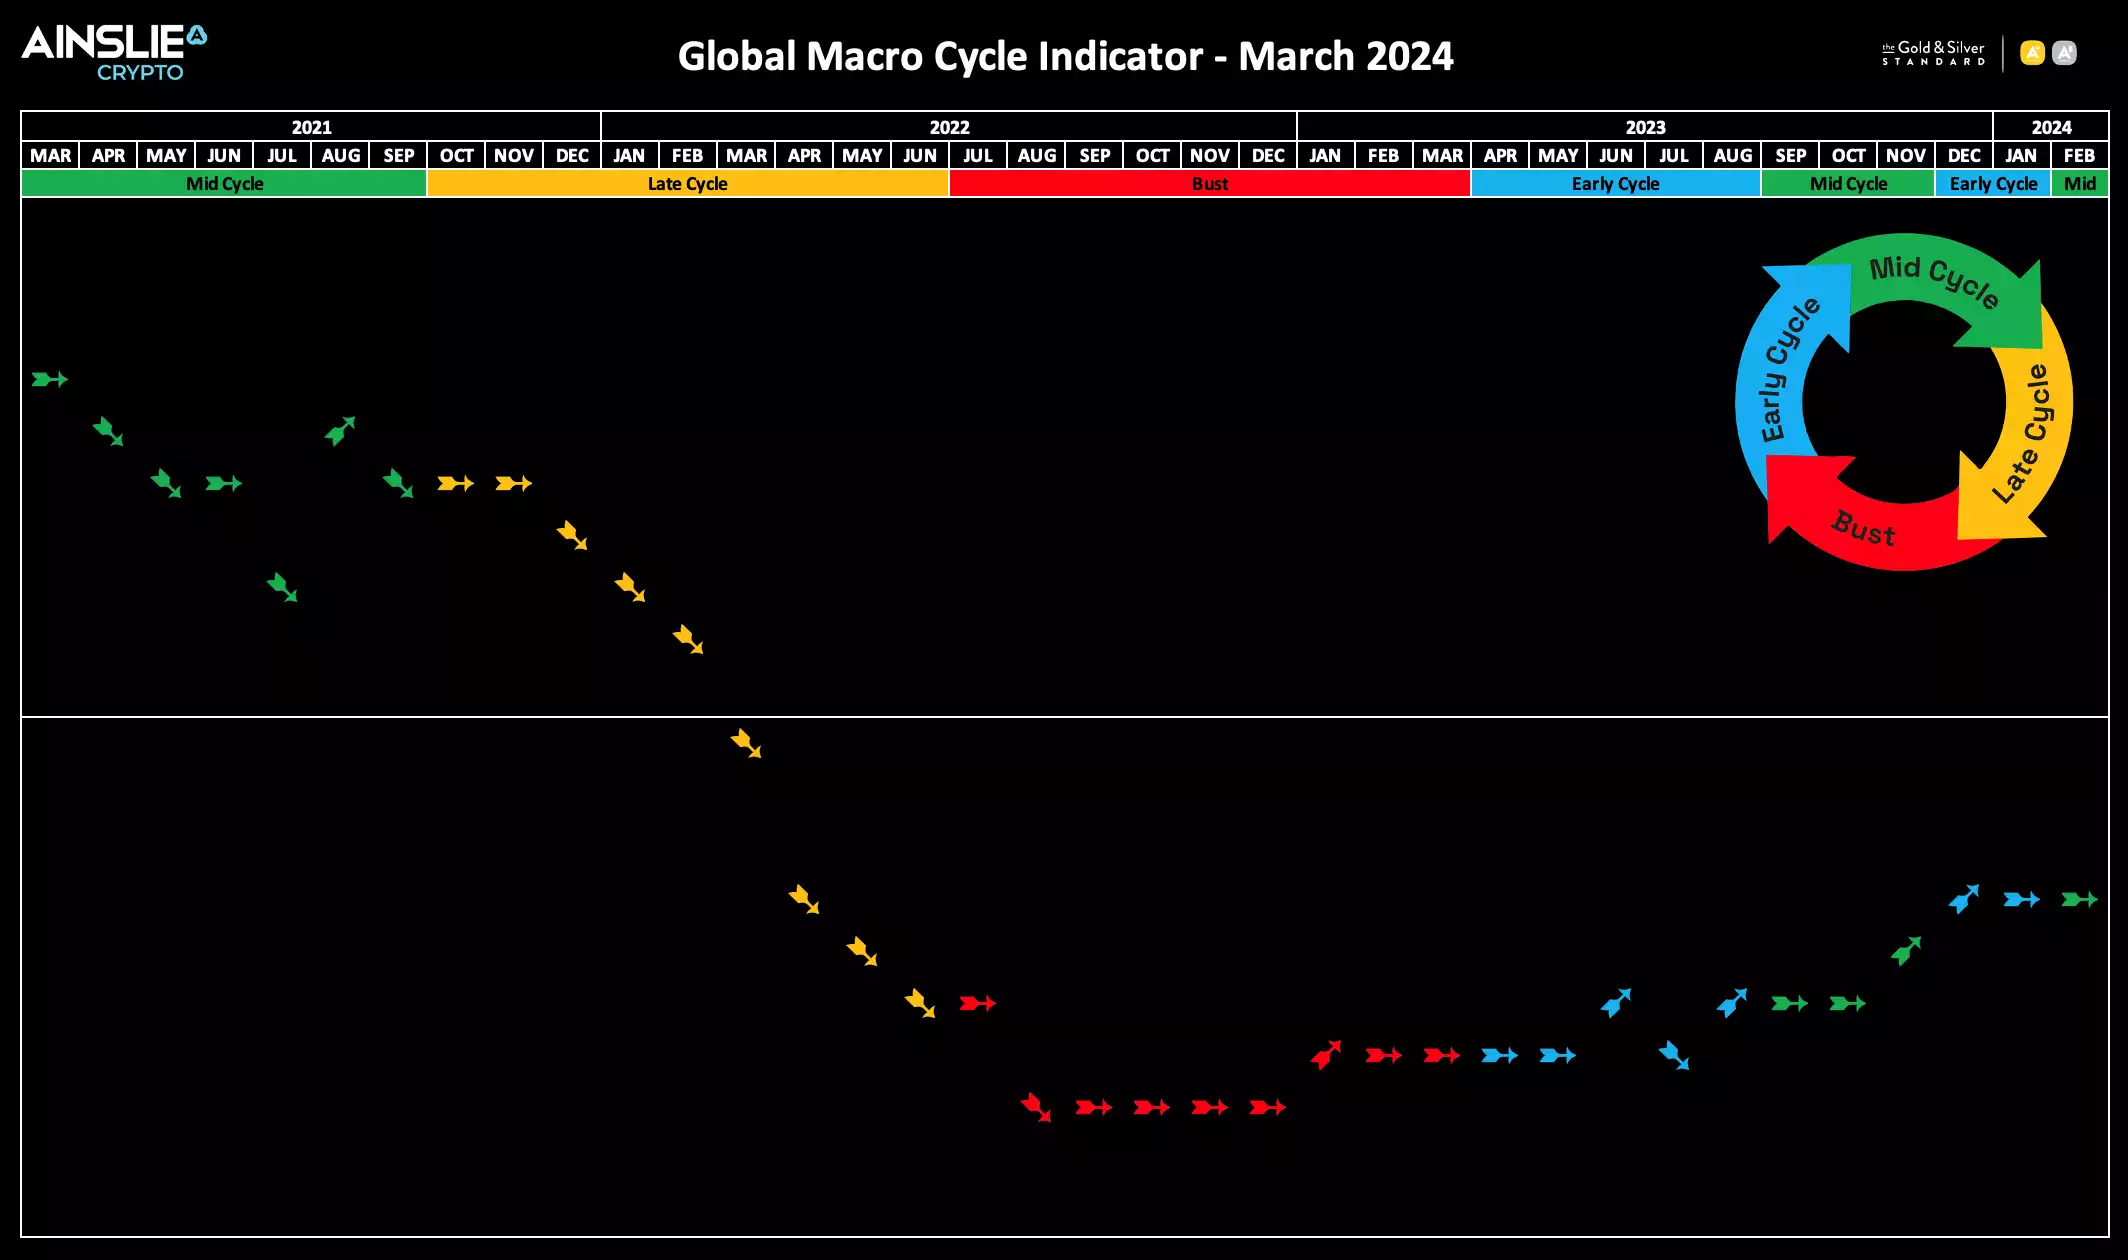
Where are we currently in the Global Macro Cycle?
Continuing from last month, we remain in the Mid Cycle phase of the broader Global Macro Cycle, still significantly below the halfway line. Mid Cycle is expected to continue into later this year before transitioning into Late Cycle late this year/early next year, with a potential topping of markets in mid to late 2025.
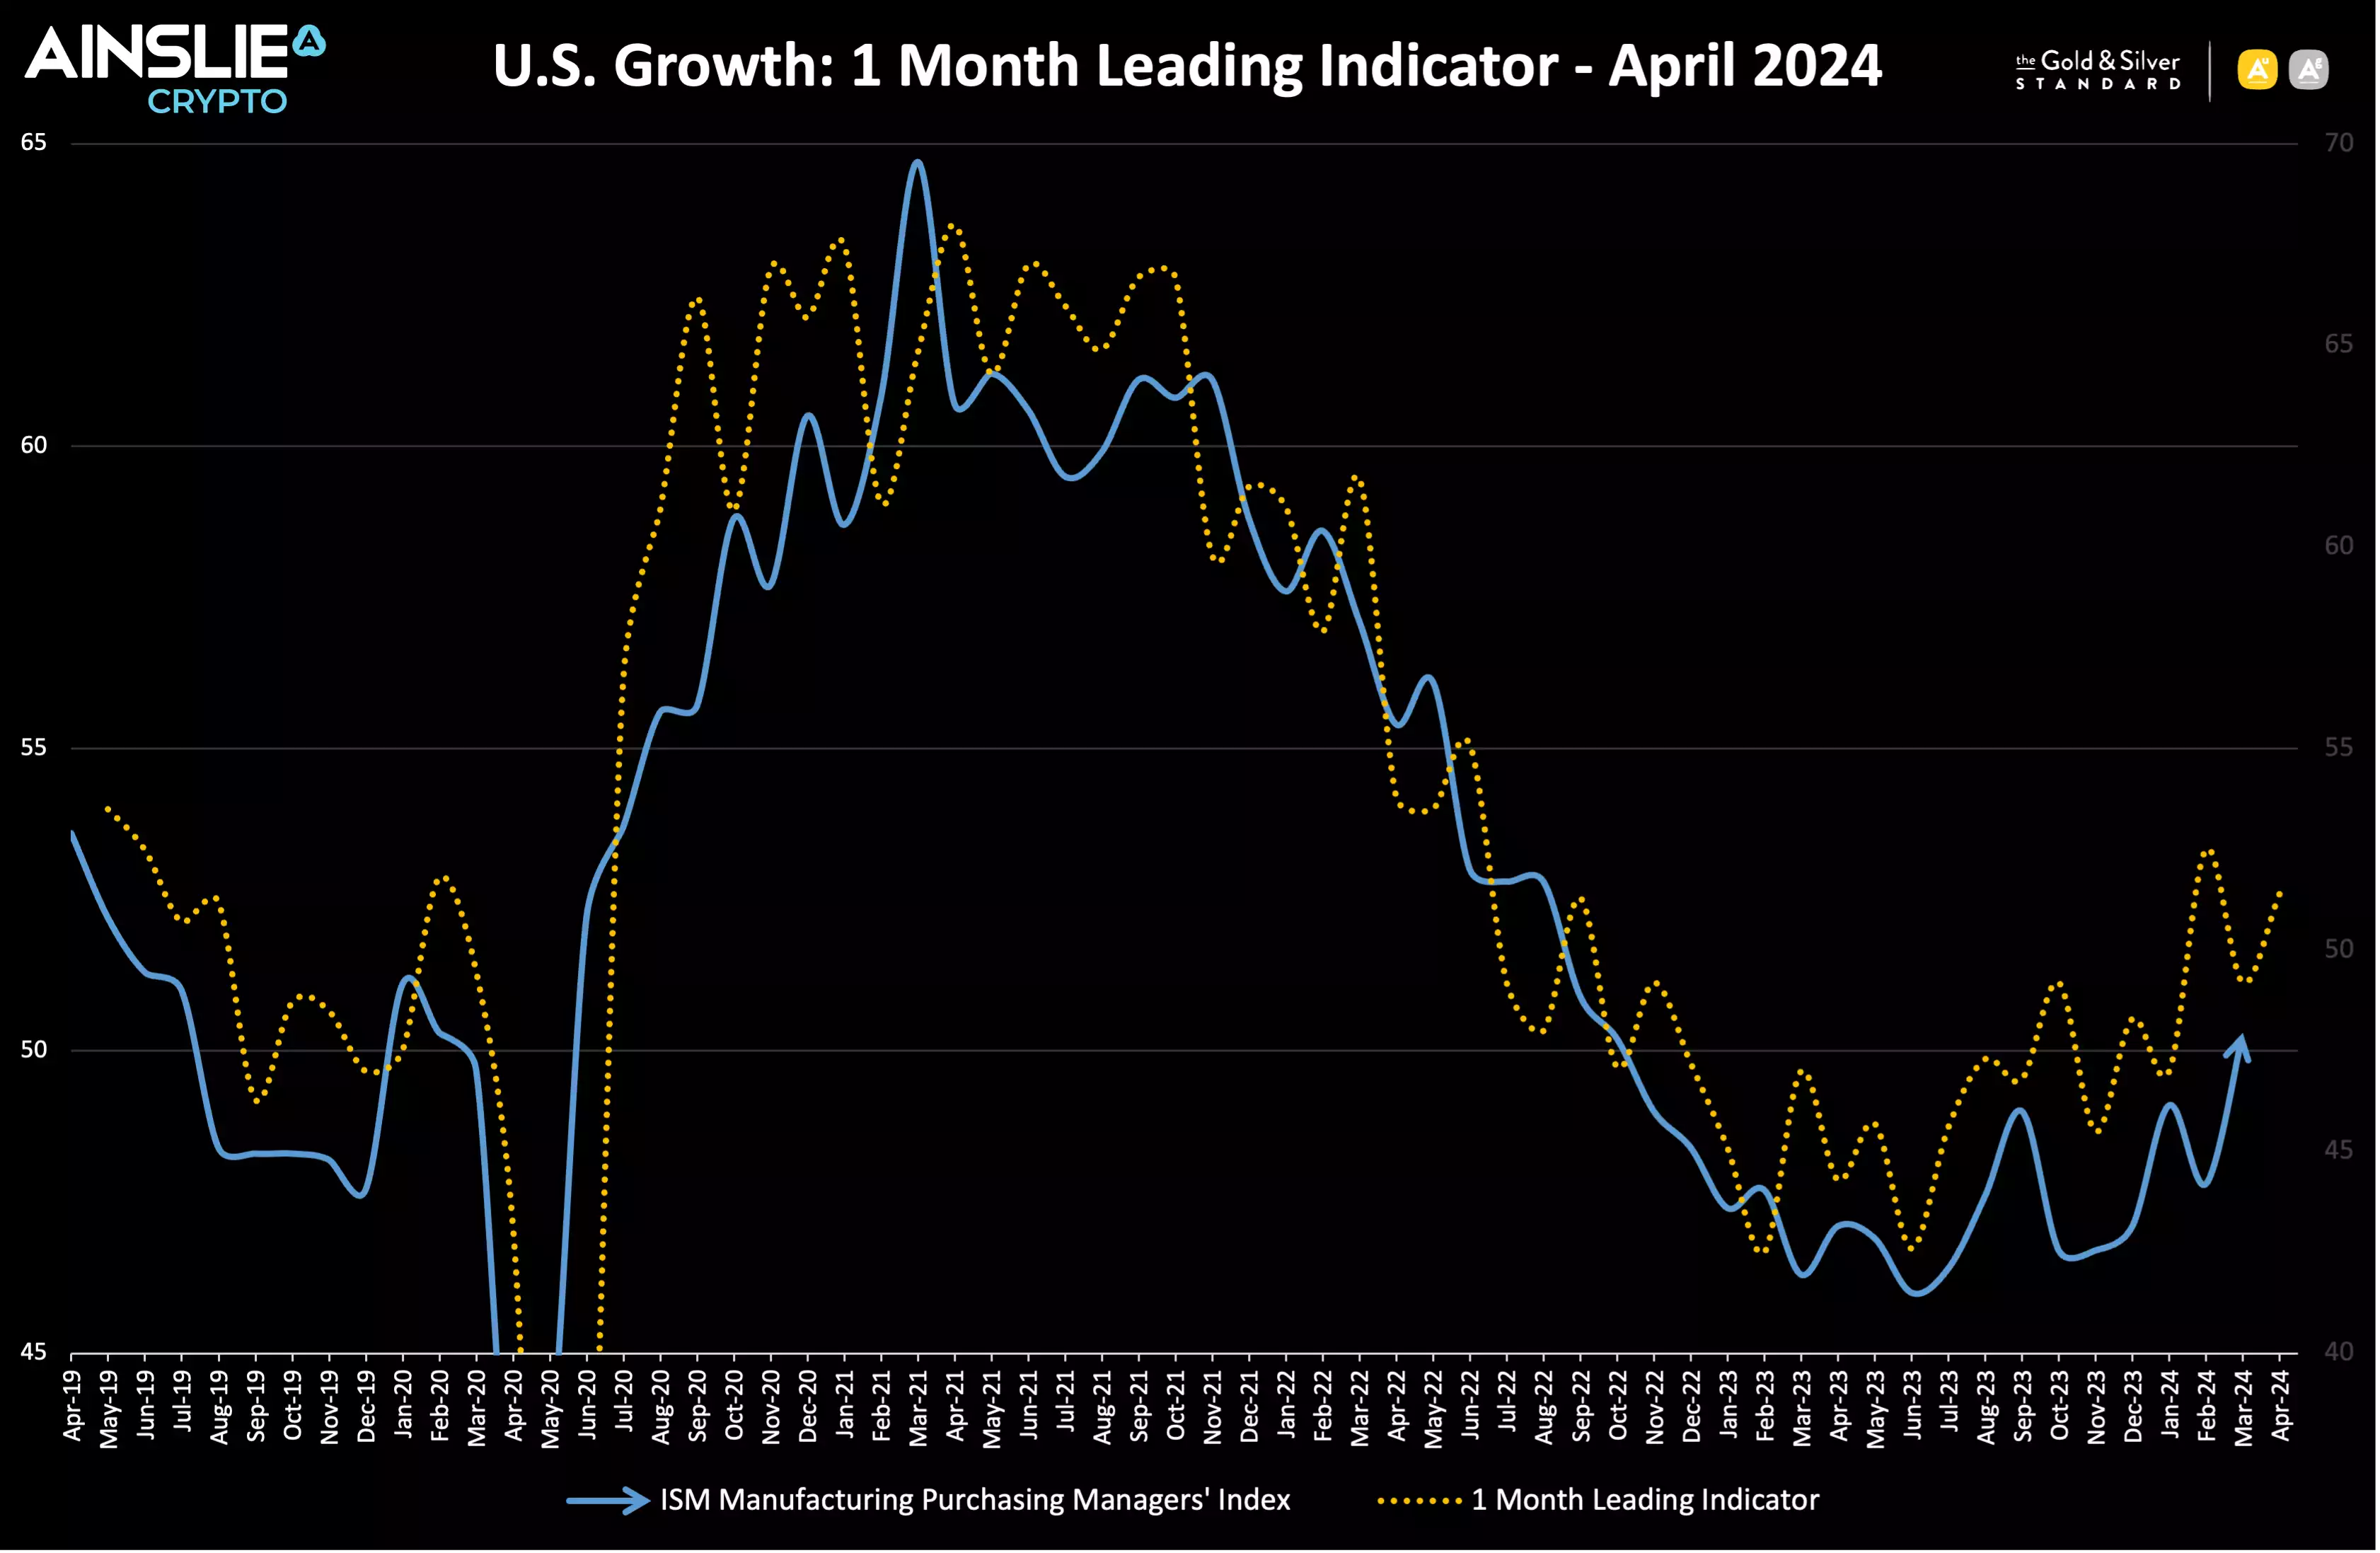
U.S. economic growth, as measured by the ISM data, is a useful tool to forecast the trajectory of the economy moving forward. The ISM growth has turned positive for the first time in 17 months after registering 51 on the index, exactly as we predicted last month using our leading indicators. While the bears have been wrong for the last 18 months, the ‘no landing’ economic scenario is starting to become a consensus view as growth accelerates.
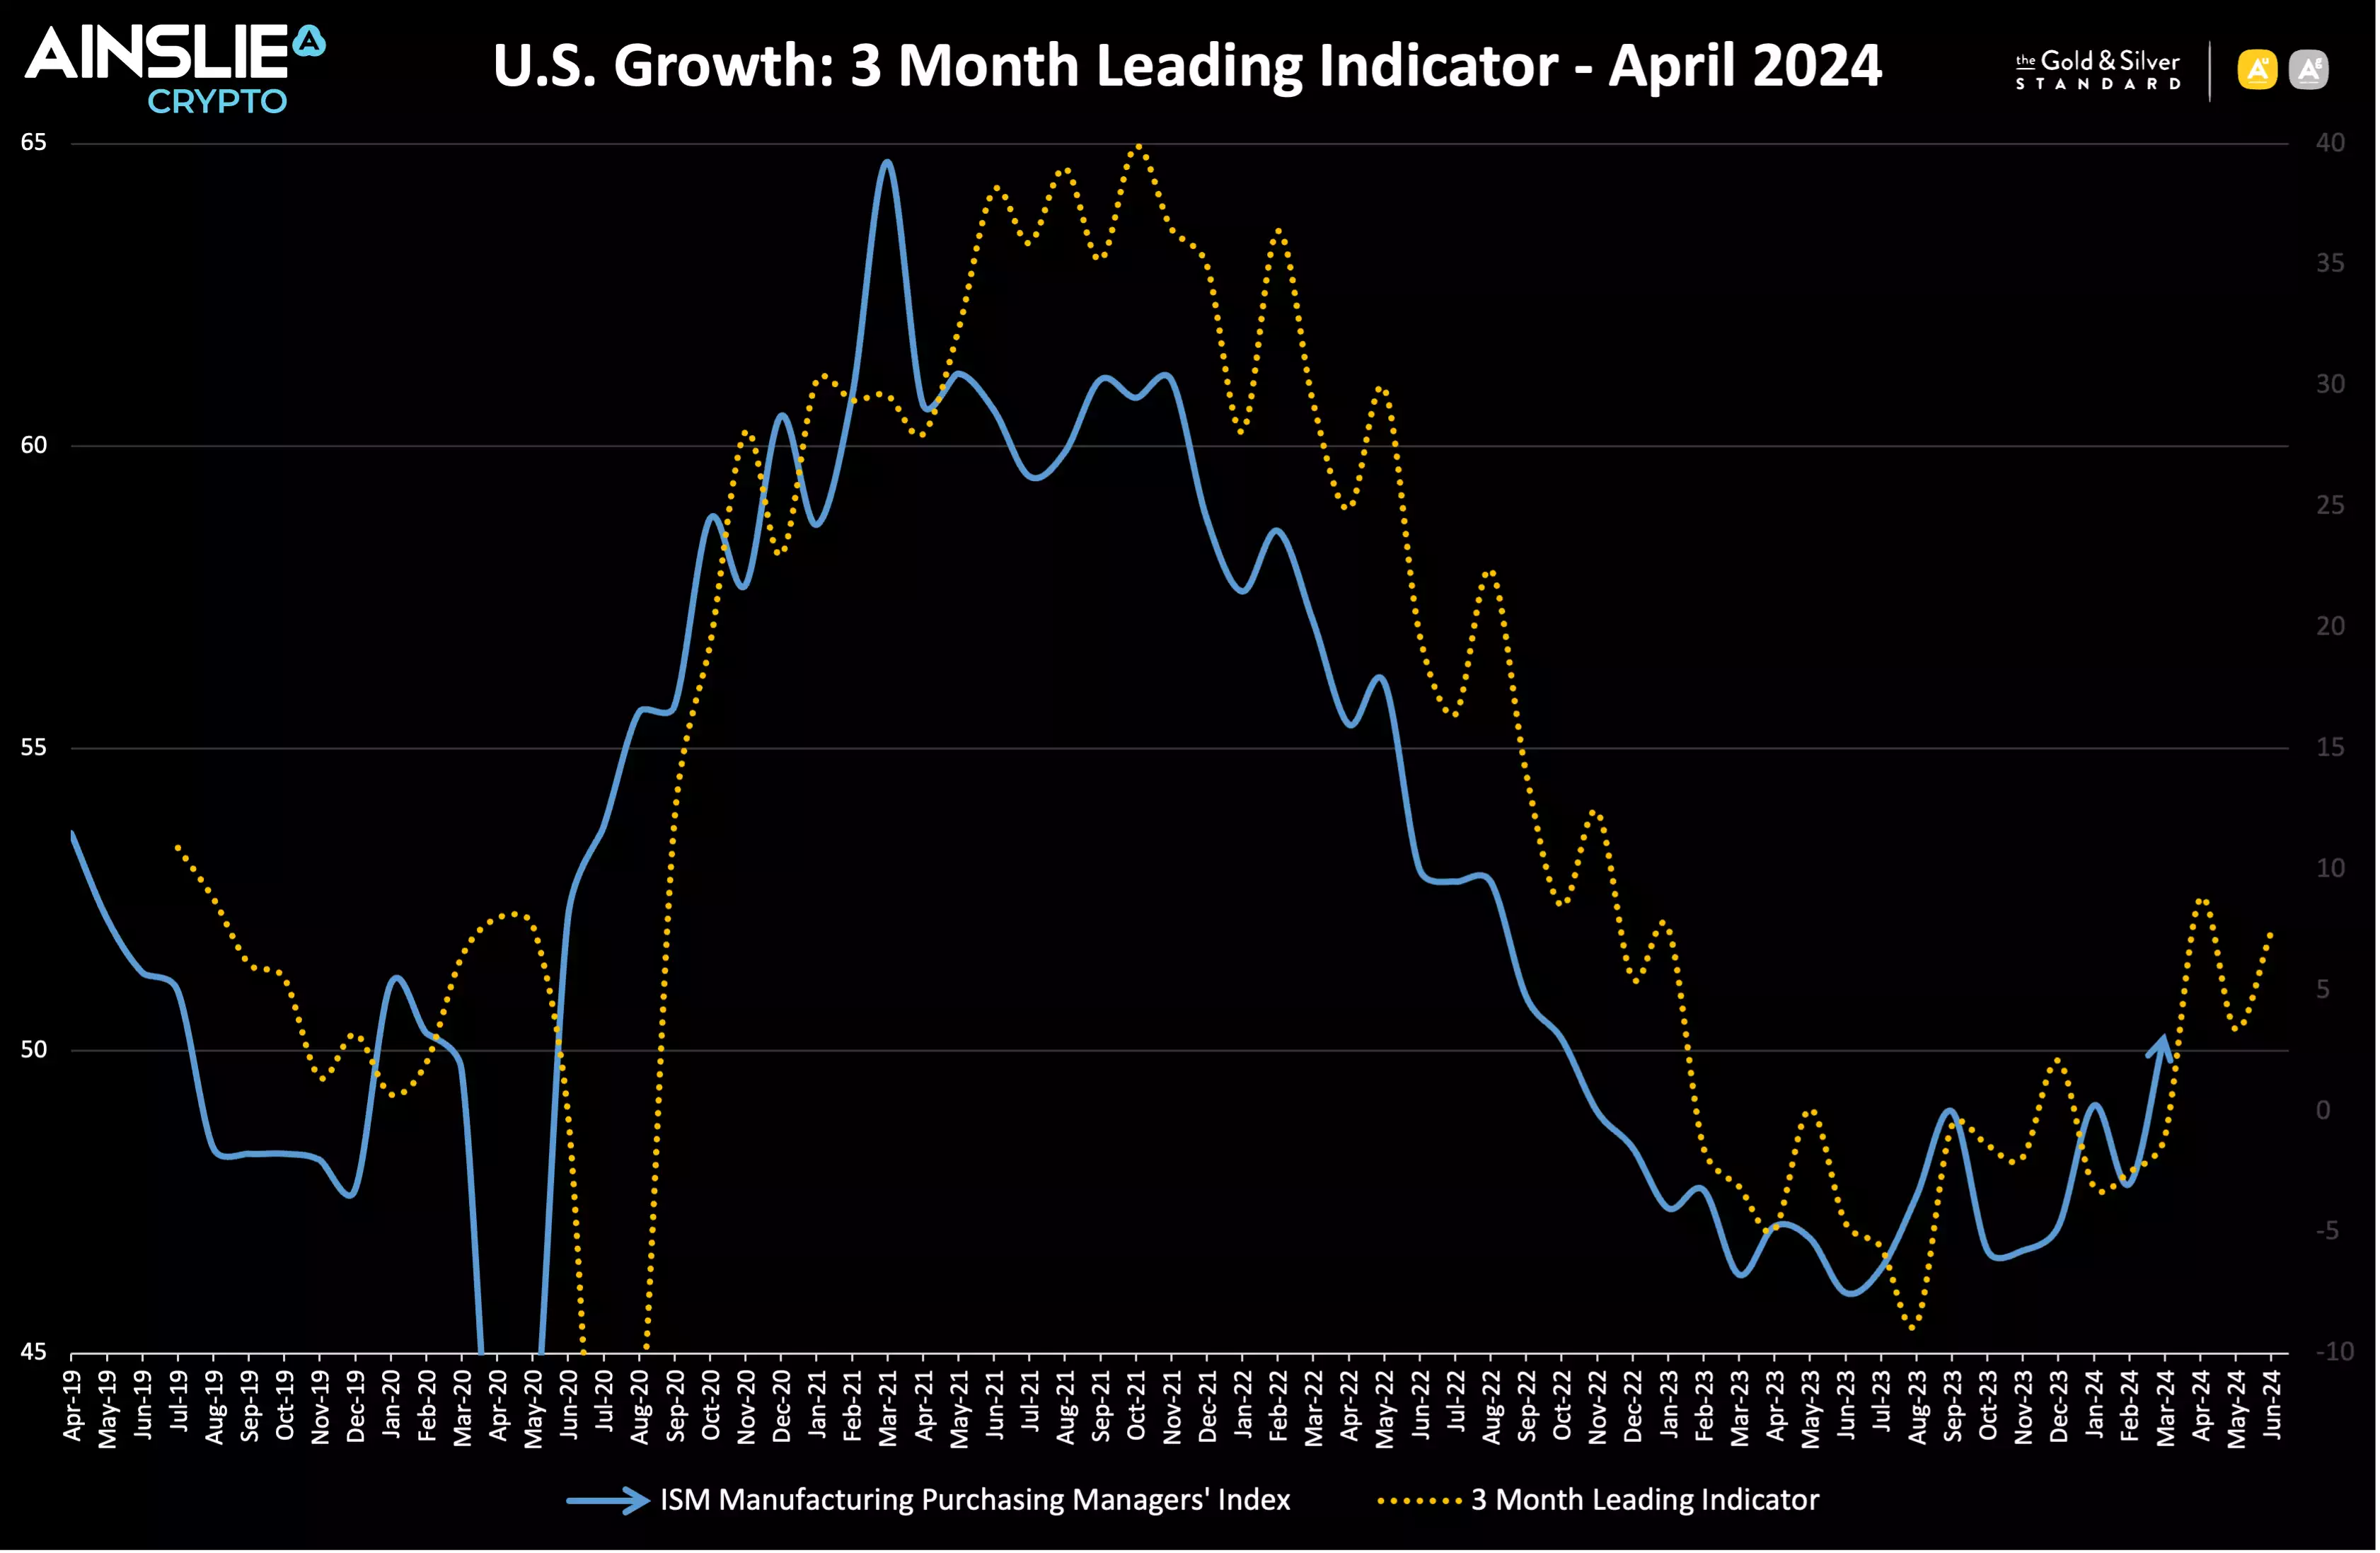
It is important to note that the ISM spends most of its time in expansion territory (above 50). Our 3-month ISM leading indicator is telling us ISM expansion is expected to continue.
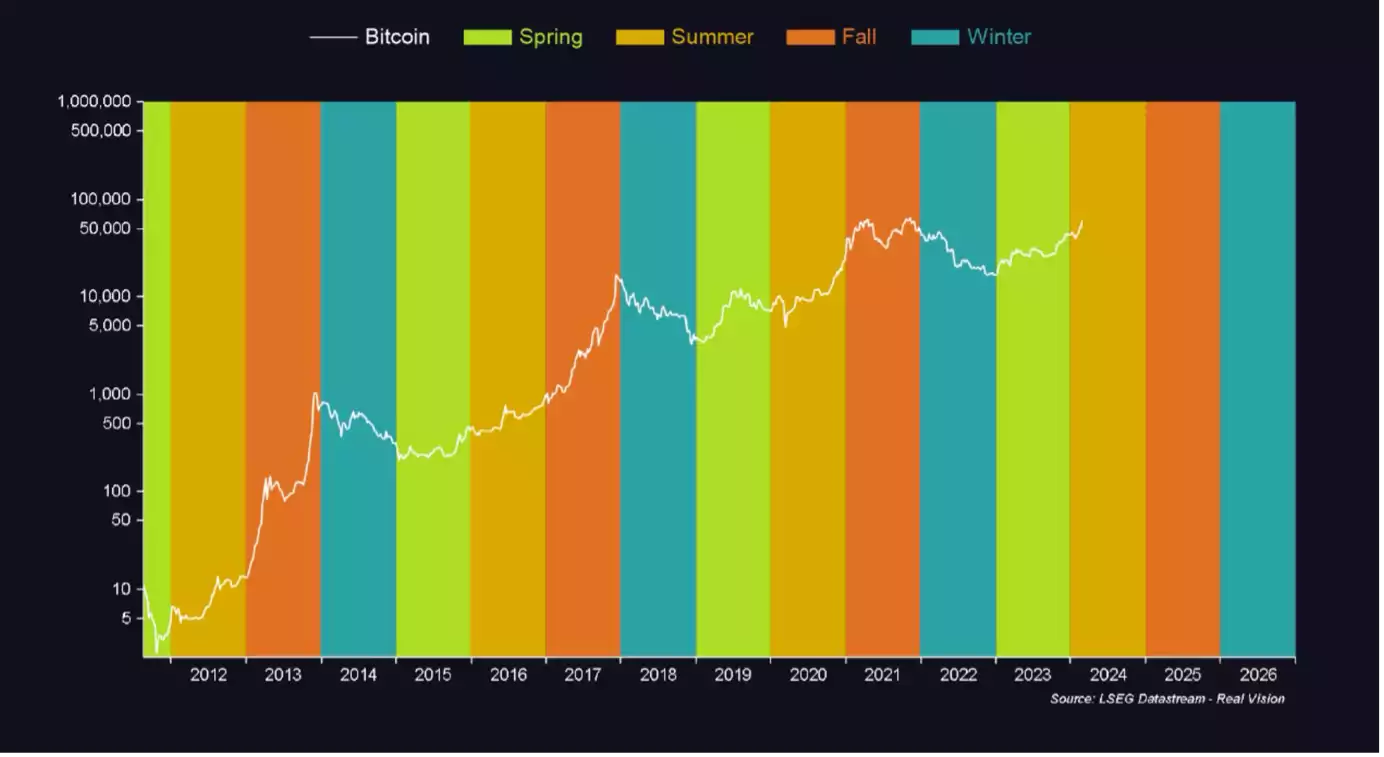
Looking closer into Bitcoin’s seasonality which closely align with the Global Macro Cycle, Summer offers investors reasonably good risk reward with a mid to long term investment horizon. Typically, Summer will underperform the multiples made during the Spring period, however this is certainly not the time to reduce BTC exposure.
Where are we currently in the Global Liquidity Cycle?
Global Liquidity leads the movement of World financial assets, so this is the indicator we look most closely at to determine where the opportunities are to take advantage of Bitcoin’s cycles.
Global Liquidity has reached a another nominal high to 172 trillion. We believe that liquidity and global markets will potentially be range bound through April and May due to seasonality. Our mid to long term view is Global Liquidity continues to increase substantially through the rest of 2024 and 2025 as sovereign debts need refinancing and Central Banks attempt to maintain market stability.
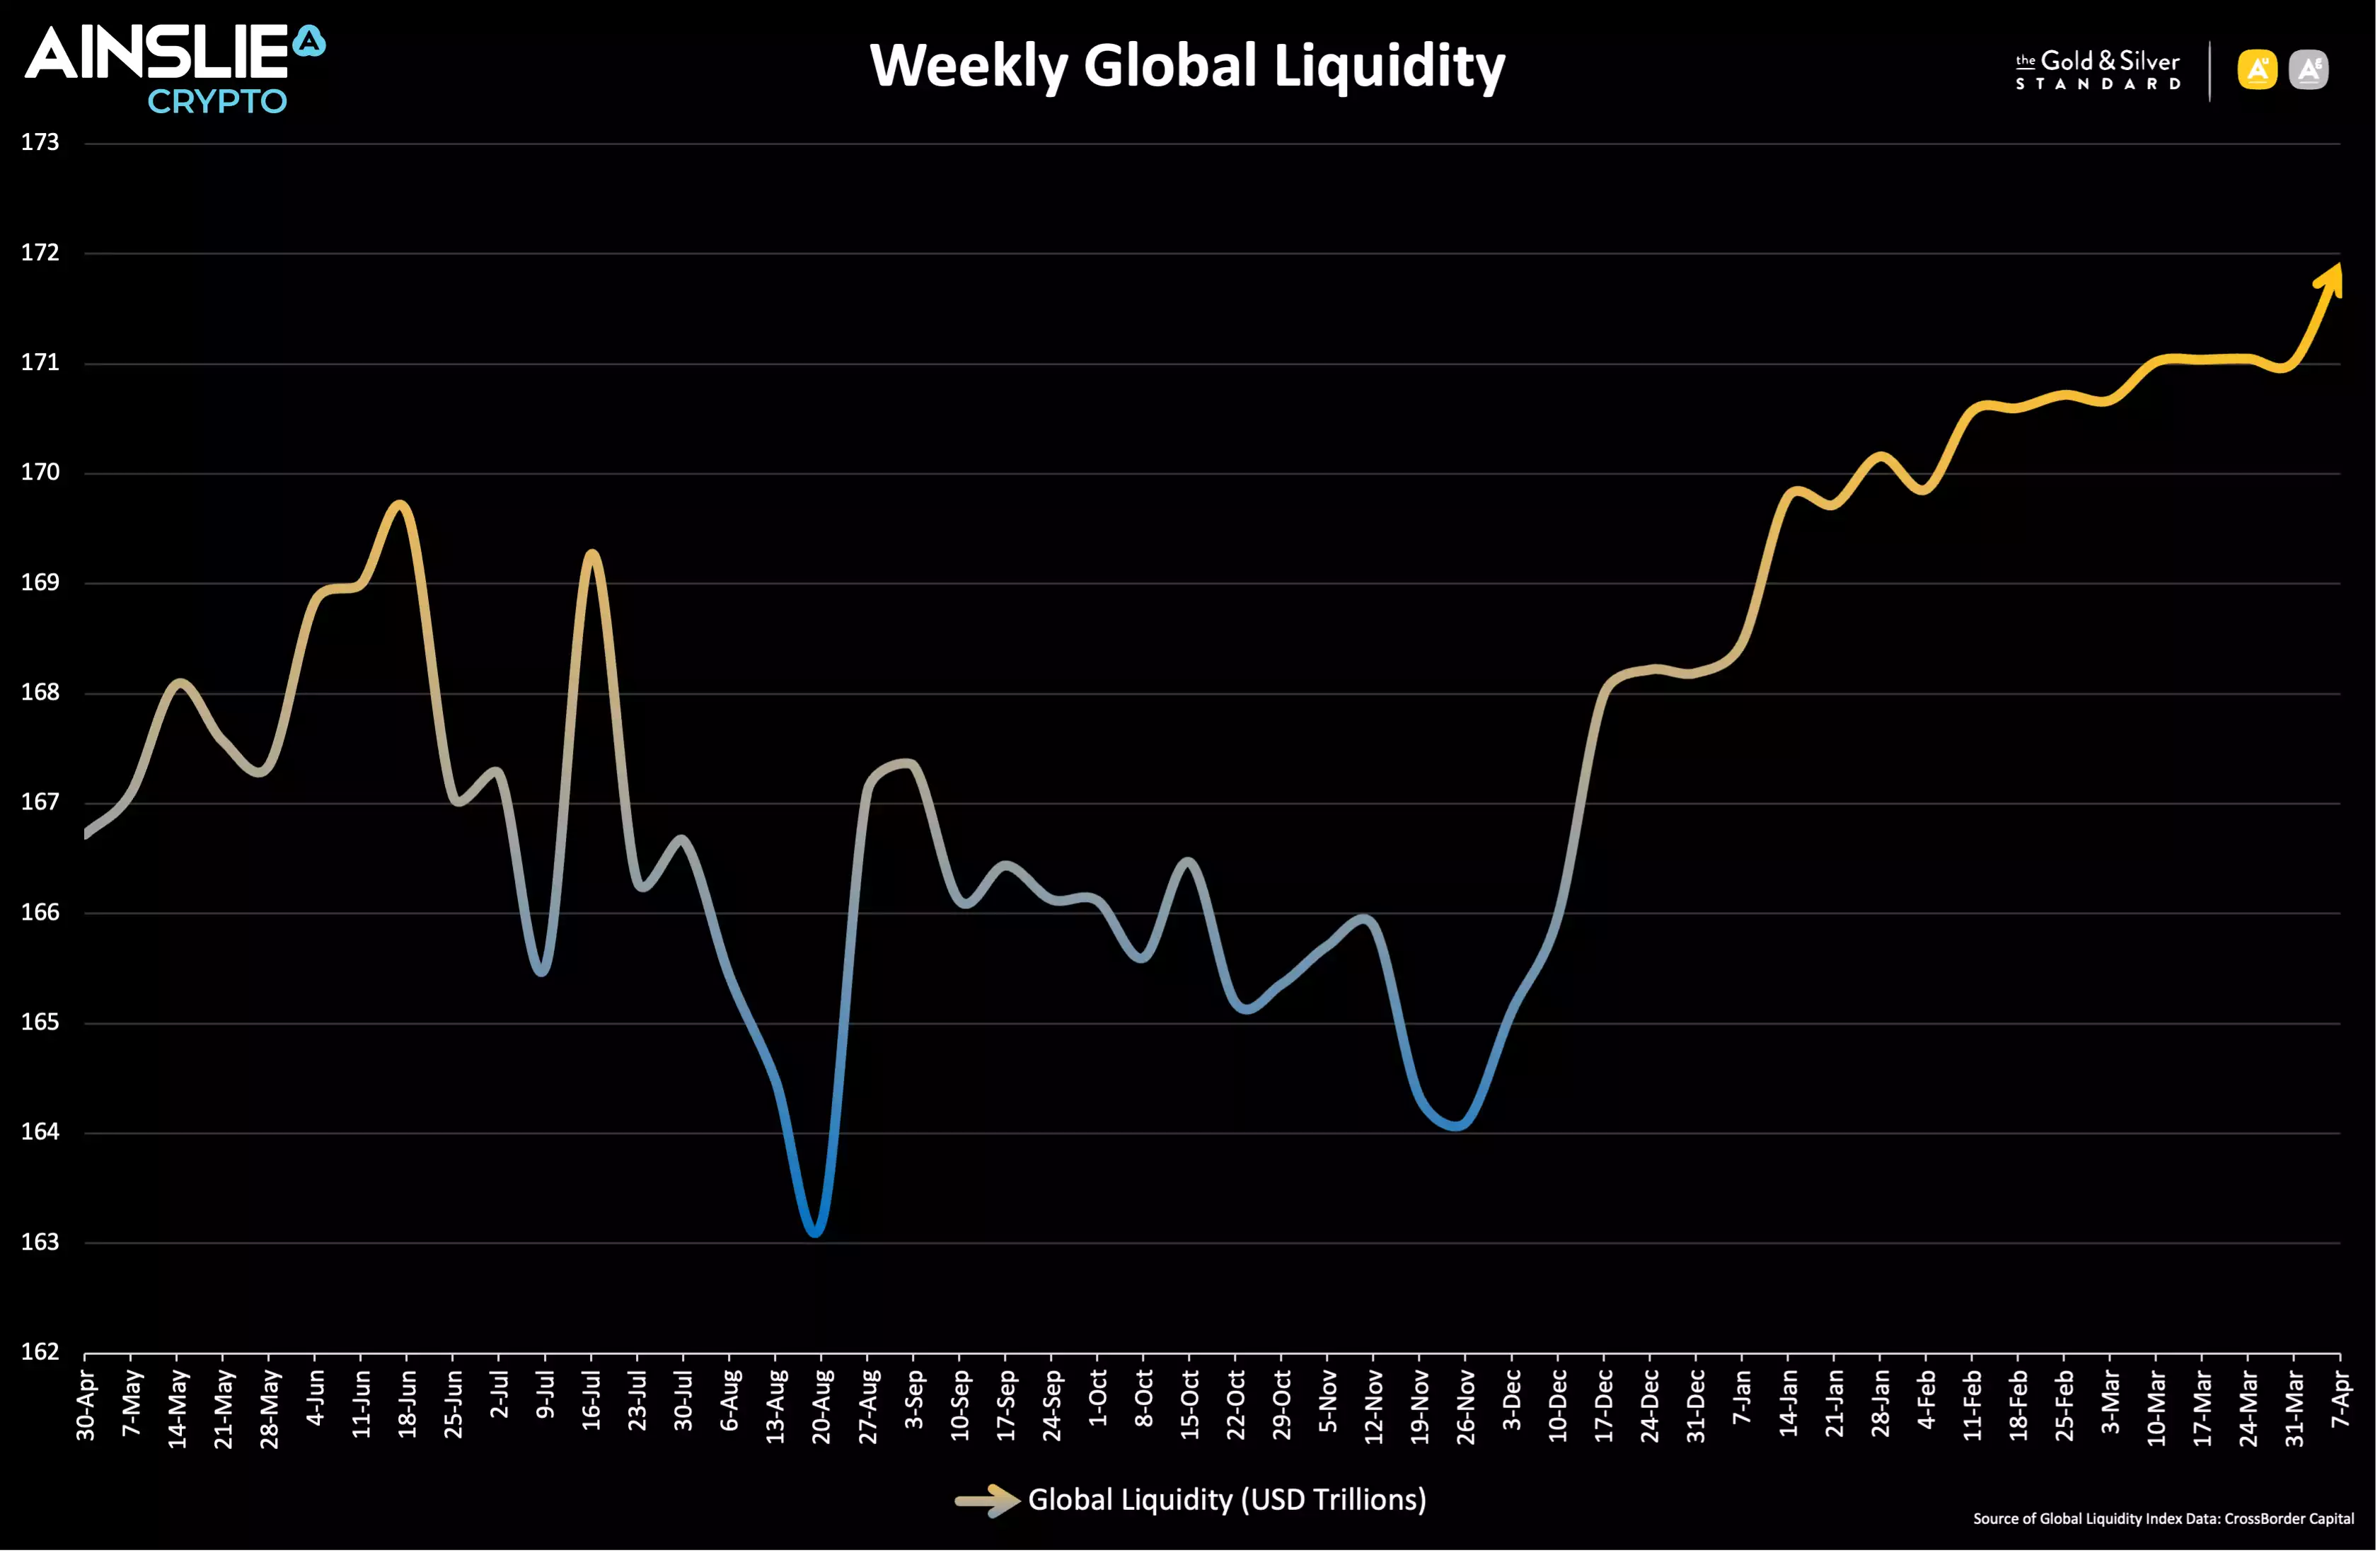
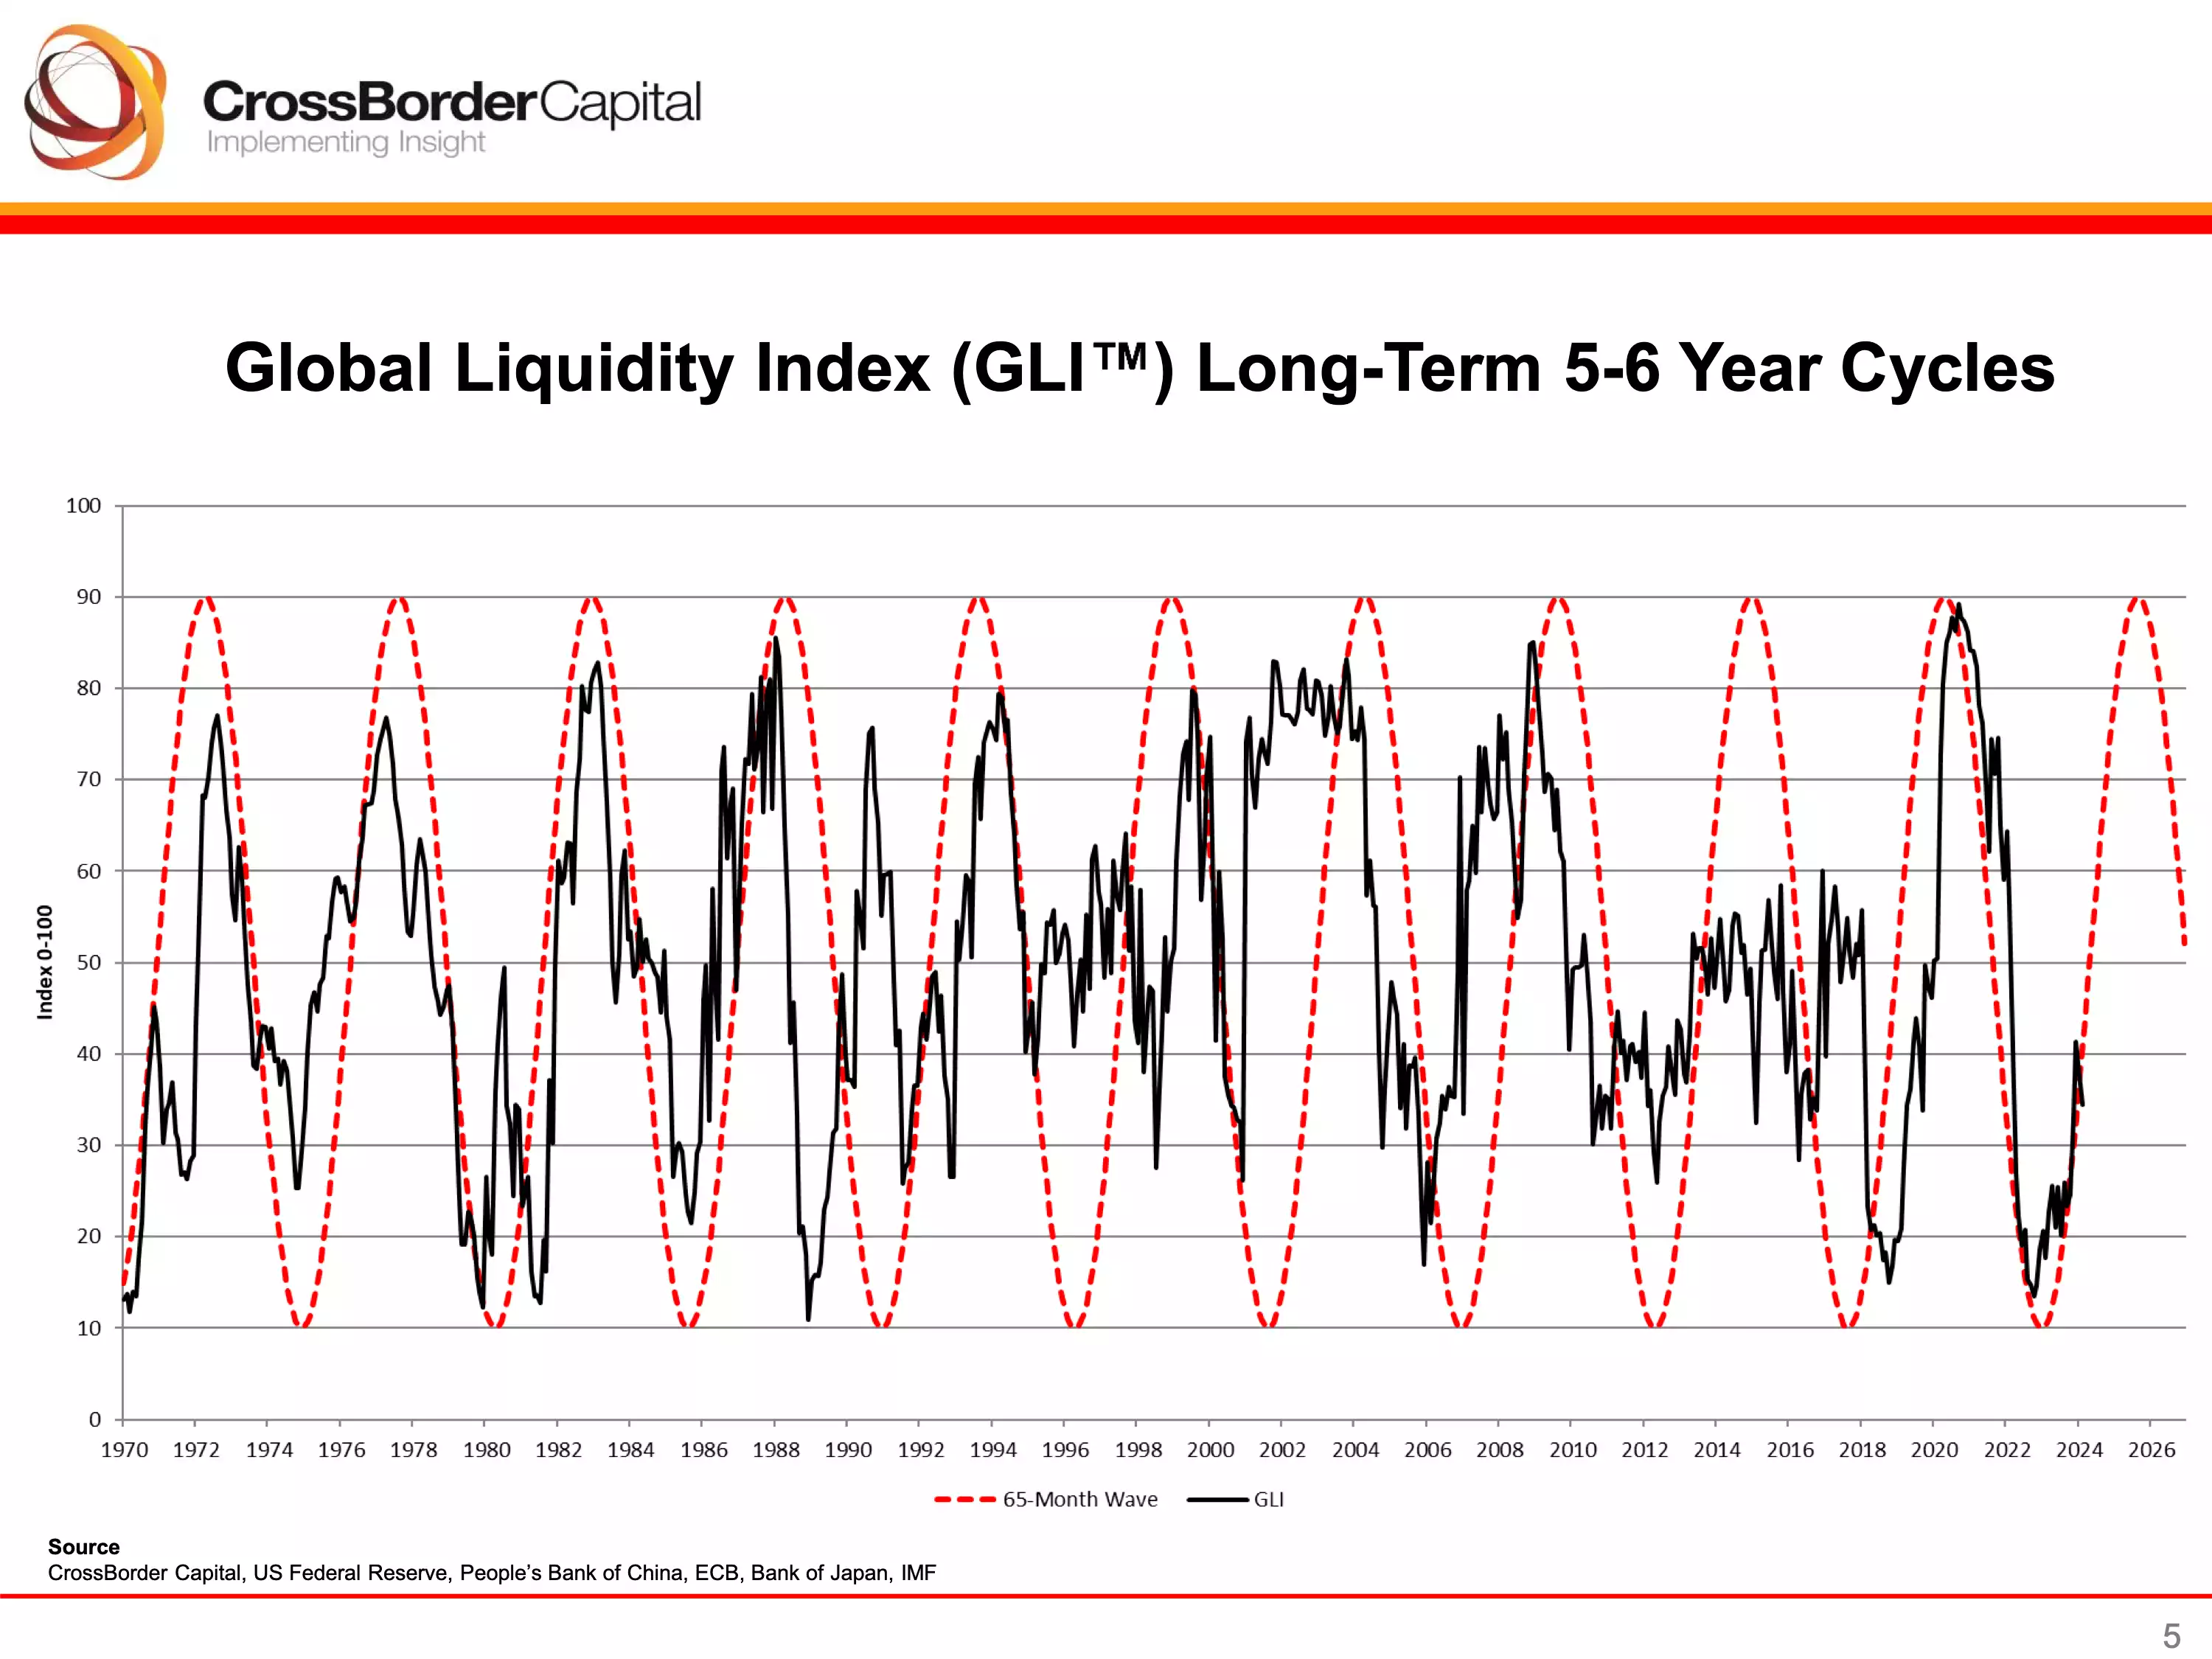
Our current Global Liquidity Index gives us a reading at just below 40 with plenty of room to move up, justifying our bullish bias for the rest of 2024 and into 2025. Note the low point of the cycle in late 2022 at the height of the U.K. Gilt crisis – crypto bottomed around the same time. Liquidity matters to markets!
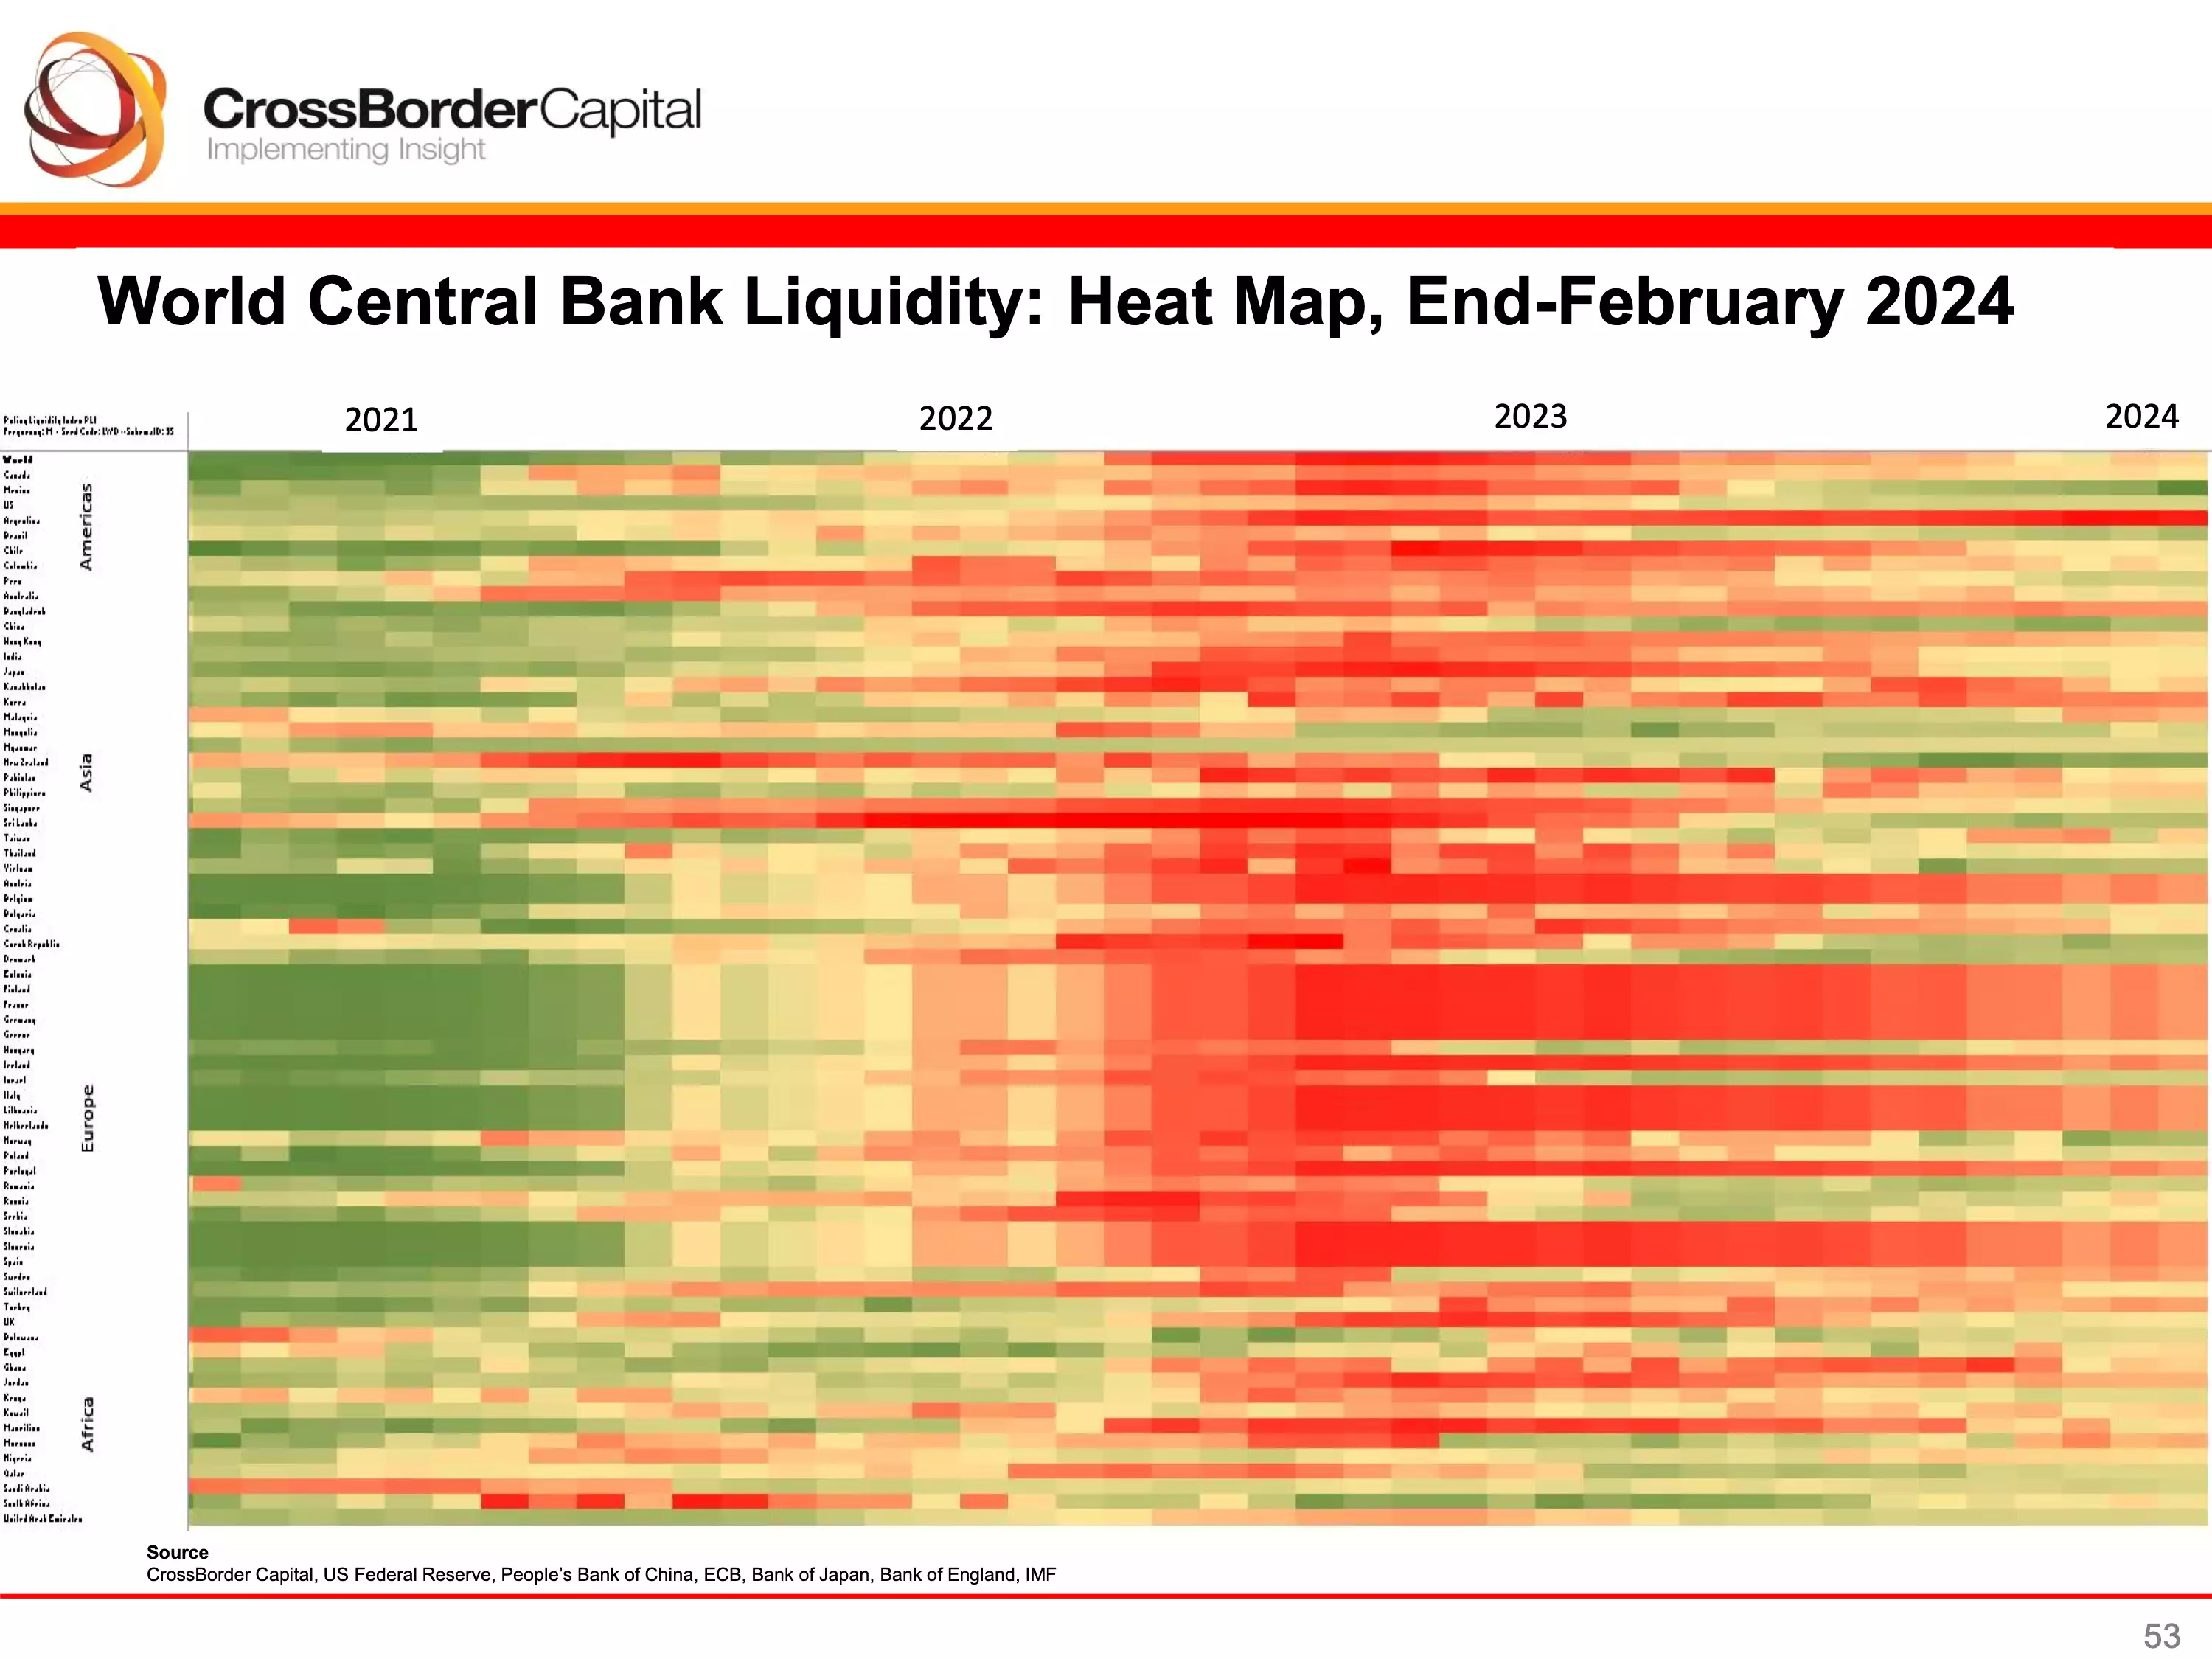
The Central Bank Liquidity Heat Map shows a breakdown of where global liquidity is being added and removed. Central Bank policy was very loose during COVID, leading to a rise in asset and consumer inflation (Green). Consequently, Central Banks around the world quickly pulled liquidity from the global economy via rate rises and quantitative tightening at the end of 2022/2023 (Red). We have since been transitioning to another loose monetary environment where asset prices that are sensitive to liquidity, like Bitcoin, continue appreciating.
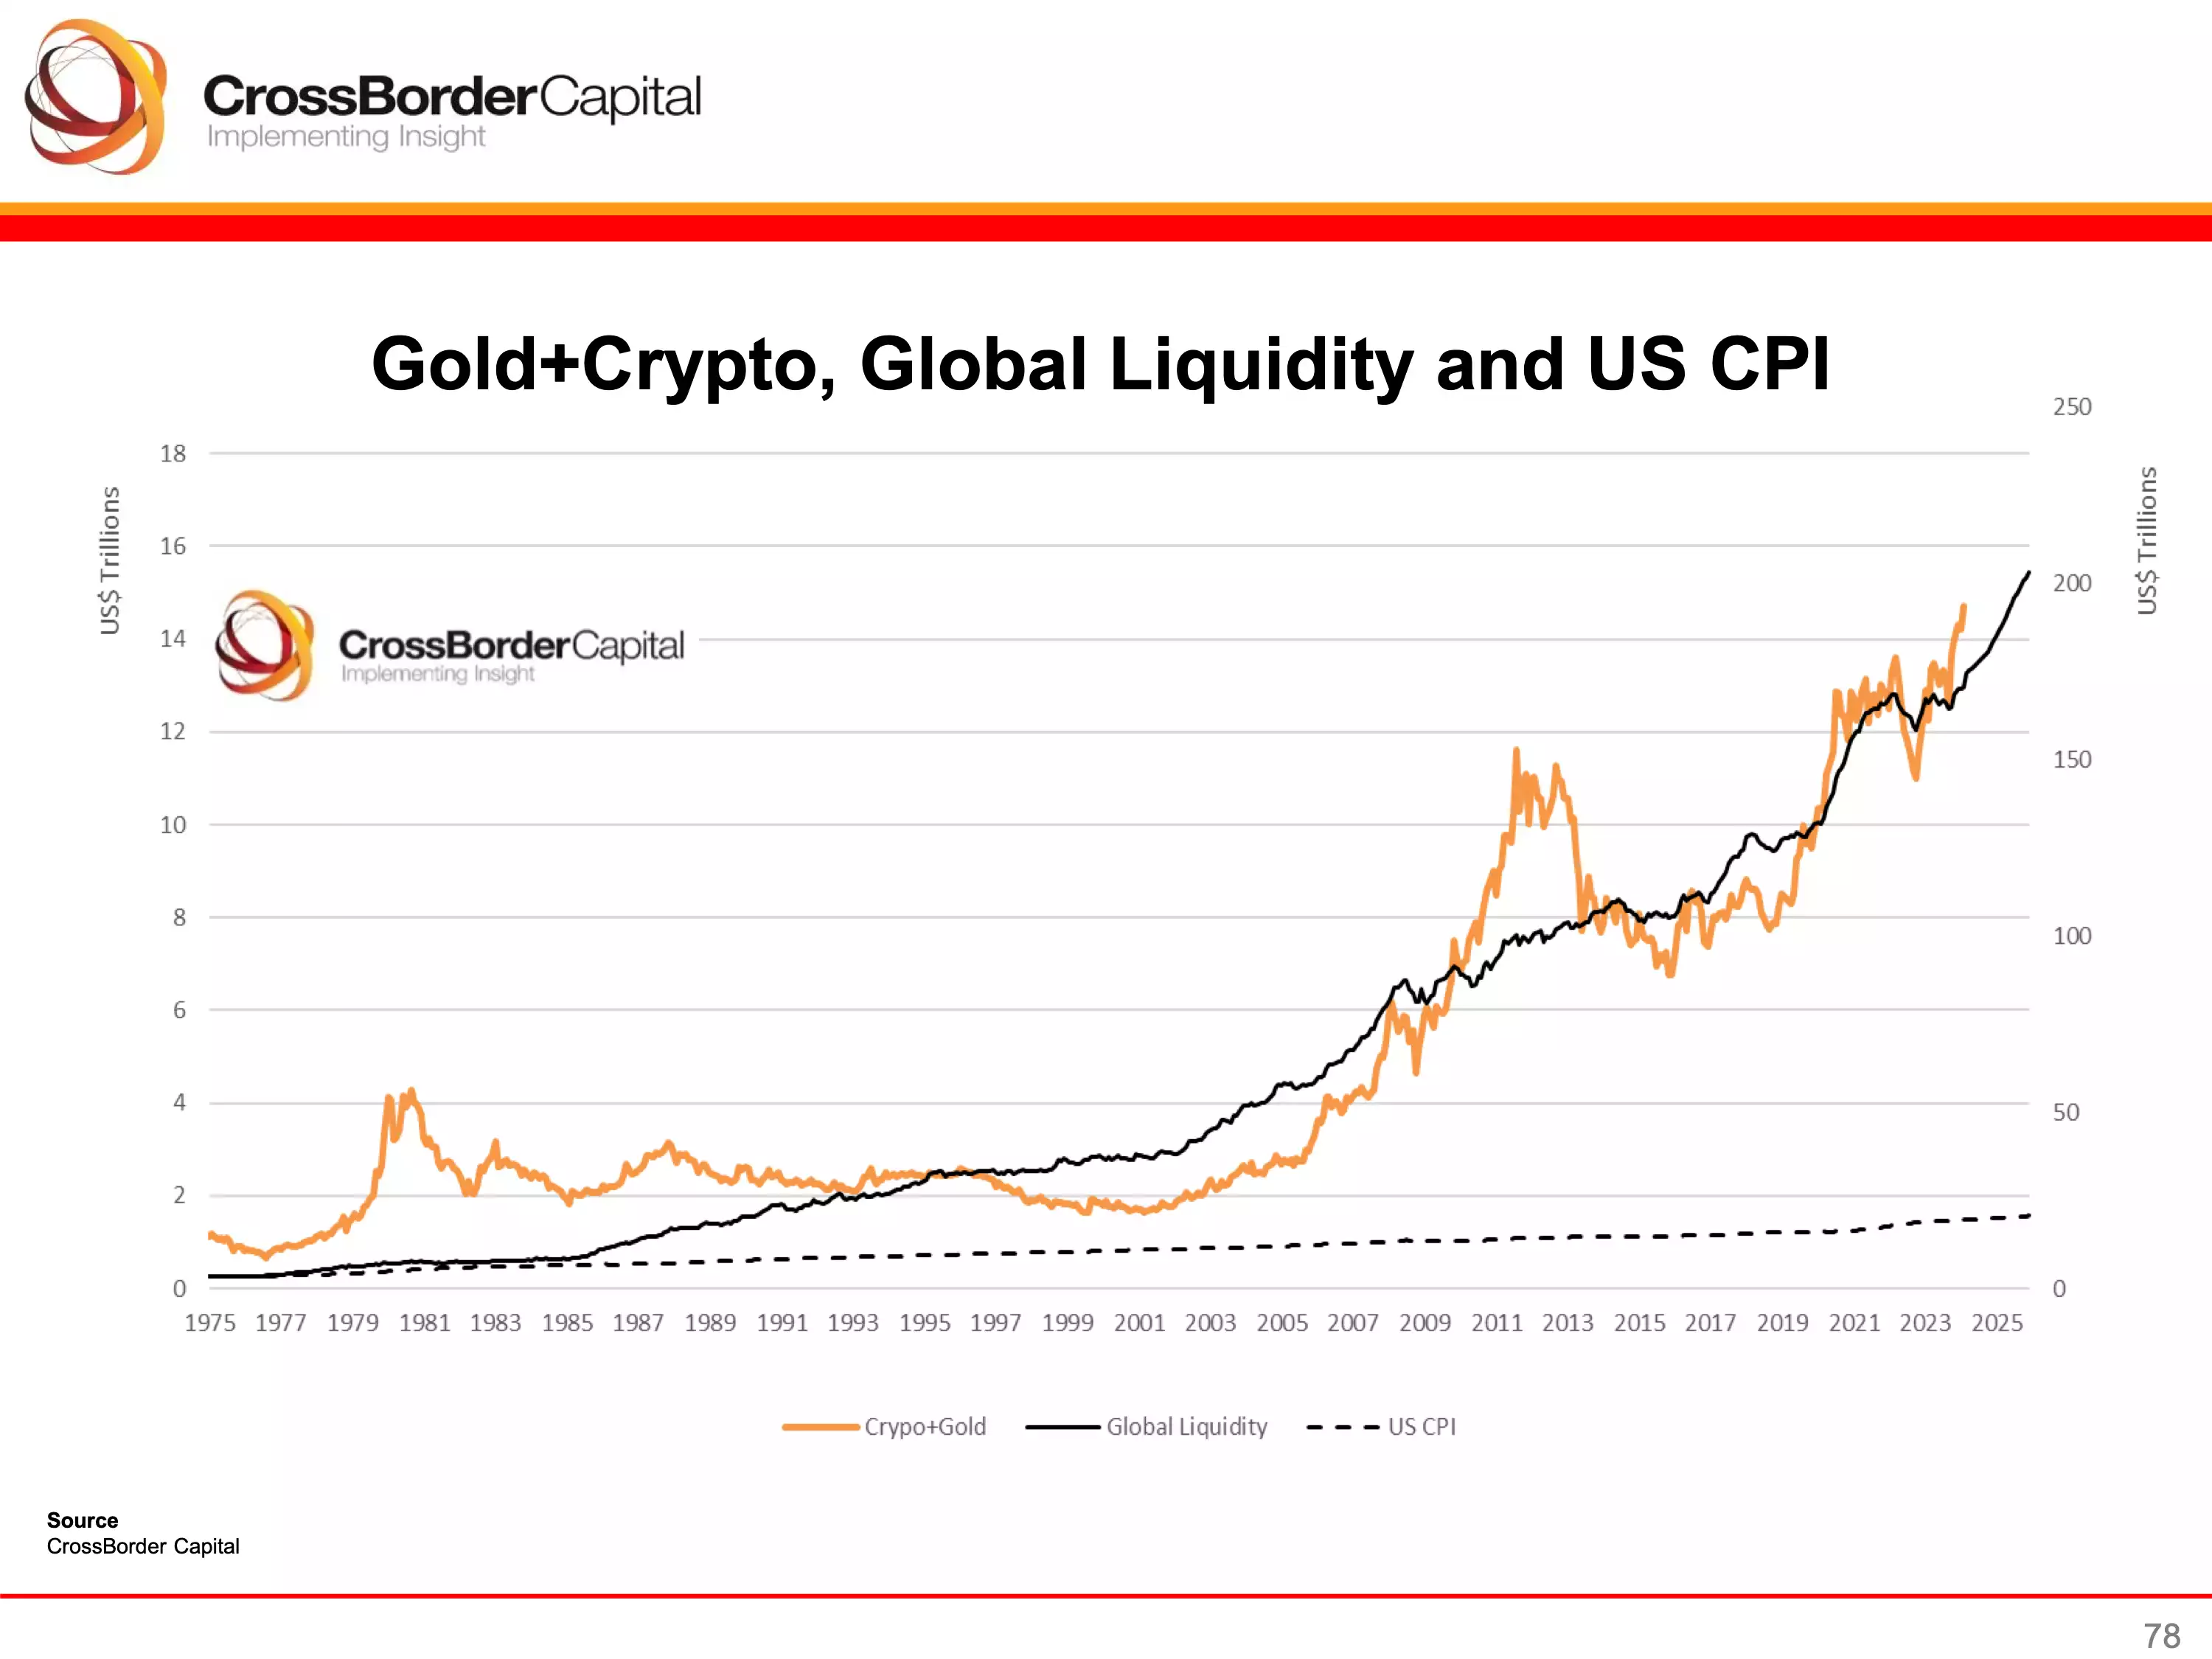
Speaking of asset and consumer inflation, this chart illustrates the importance of owning assets during times of monetary debasement. Asset inflation and consumer inflation are 2 separate types of inflation, and to protect our wealth we must own monetary debasement hedges like Bitcoin and Gold.
Hint: The monetary debasement doesn’t end anytime soon.
We also suspect that Gold and Bitcoin will outpace liquidity growth over the next 18 months leading to a large divergence between the orange and black line, much like it did in 2011 and 2012.
The Bitcoin monthly average price overlayed with liquidity tops and bottoms shows how sensitive it is to liquidity. We were able to enter back into the market close to the liquidity bottom, but the time to exit has not arrived yet.
Why the ETFs matter… and some perspective
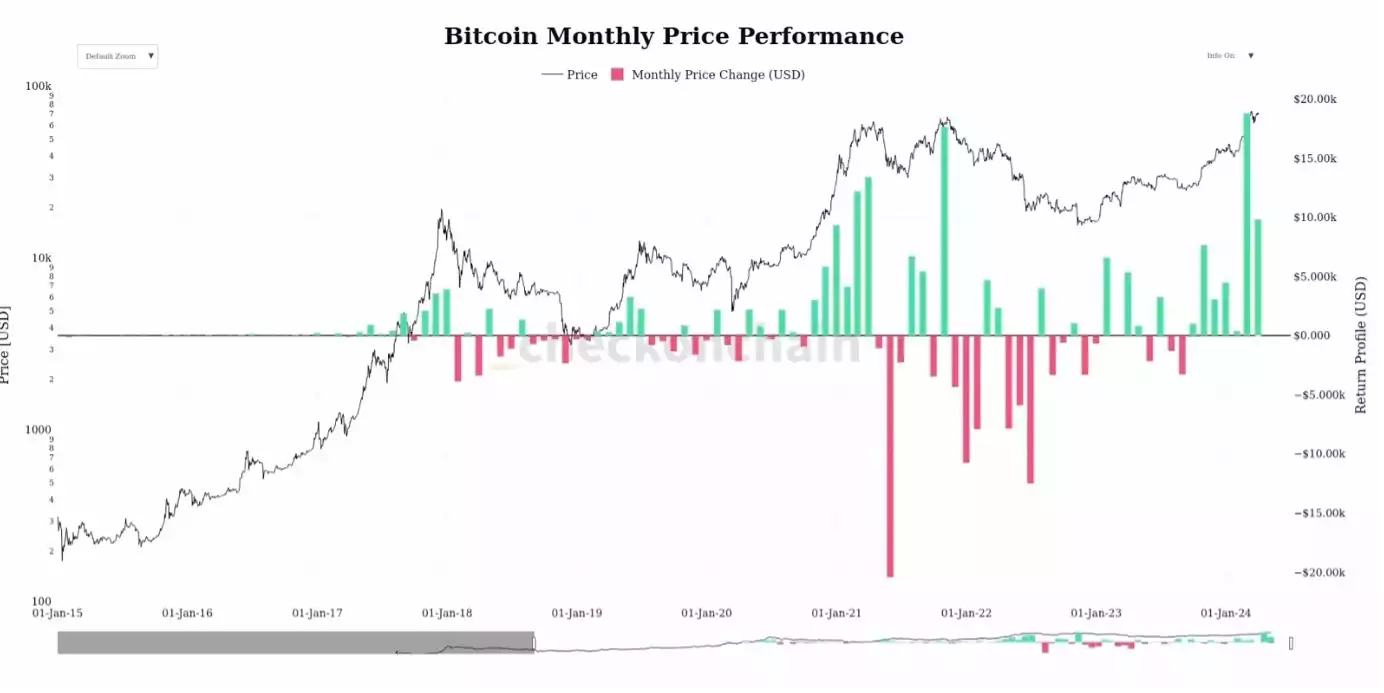
First, let’s look at the historic run in the Bitcoin price over the past 6 months to put the current price action into perspective. February saw that largest nominal gain in its history, appreciating over US$19,000 (a 45% gain). Followed by another sizable gain in March of US$8,000 (a 13% gain). It’s fair to say we needed a breather!
It’s clear ETFs are having a meaningful impact on price action. It is estimated that 30-40% of new cash flow into Bitcoin is being driven by ETFs. The chart below demonstrates the correlation.
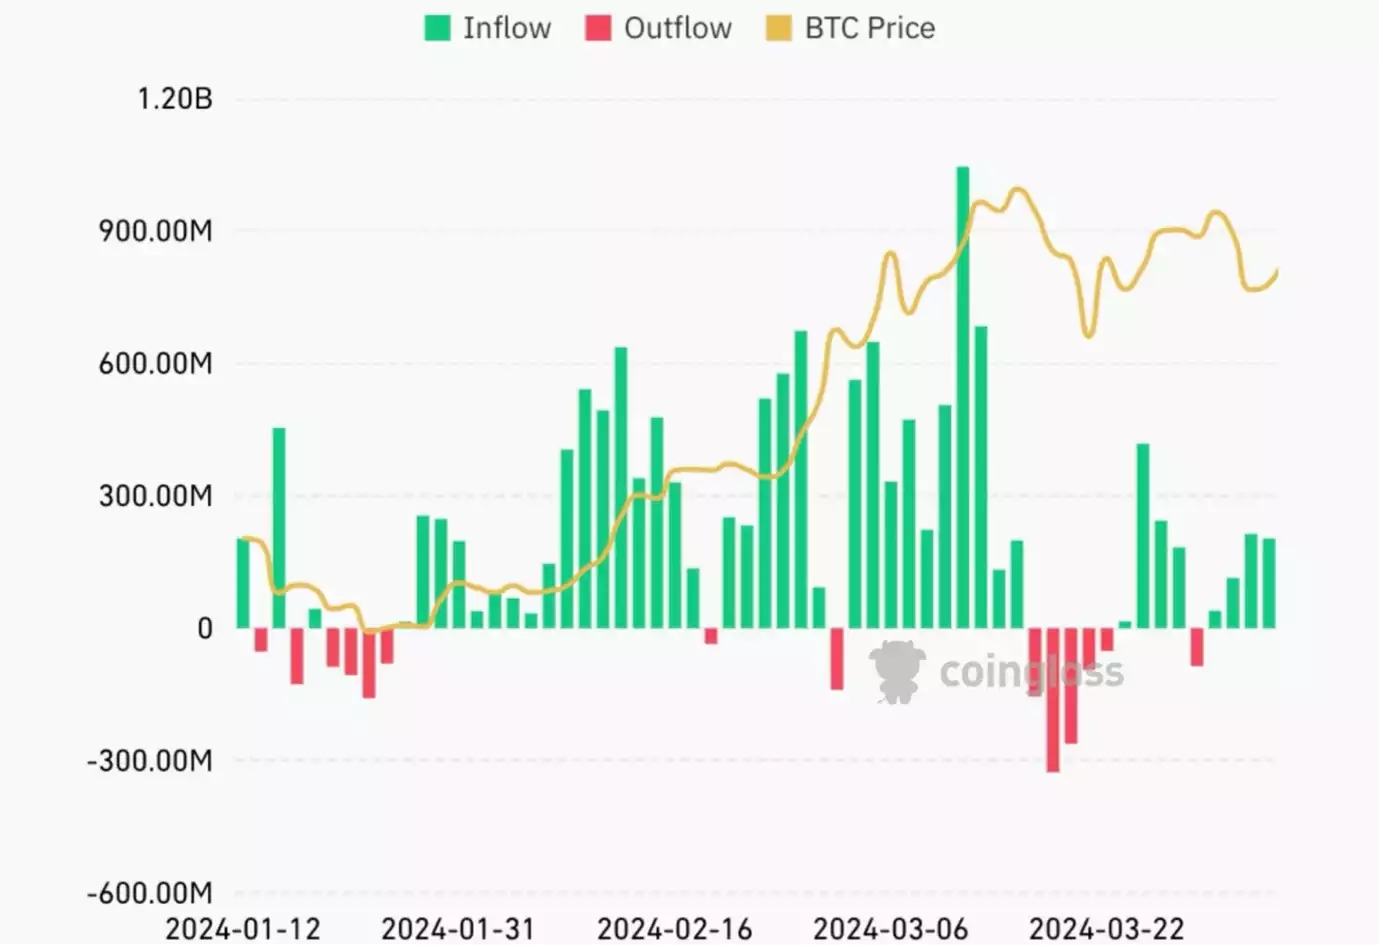
Last month we spoke about the net outflows of all ETFs and we predicted the following weeks would turn positive, and this has unfolded to plan. We believe GBTC is acting as long-term holder sell pressure for this current cycle. Selling from GBTC will likely continue for the rest of the cycle, but become less significant over time.
A day-by-day breakdown of flows in Bitcoin.
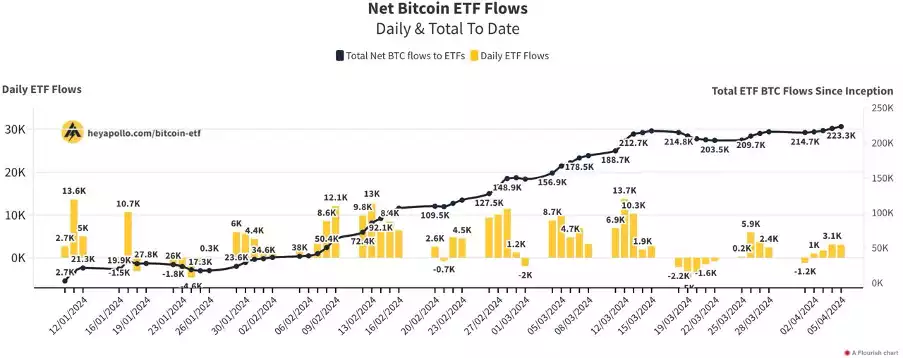
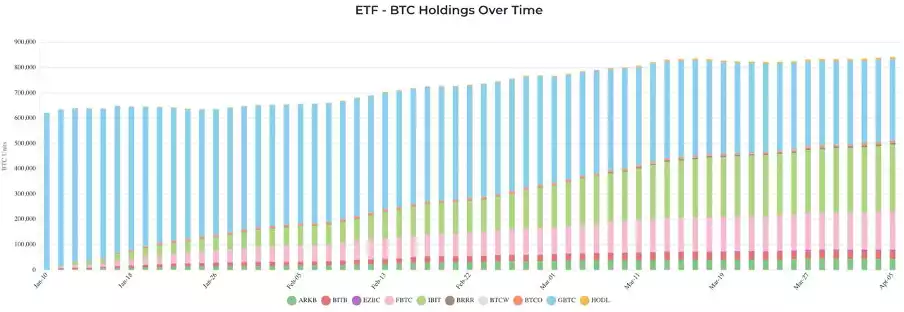
While GBTC selling is still high, $303 million of outflows at time of writing, BlackRock (IBIT) and Fidelity (FBTC) alone continue to absorb large amounts of this Bitcoin. GBTC assets can only be sold once while Bitcoin moving into IBIT and FBTC are considered ‘sticky’ long term holders.
Conclusion
Continuing with our market analysis from last month, ‘Crypto Summer’ is upon us. We consider Bitcoin to have a relatively good risk to reward over the next 12 months. We also expect seasonal volatility in liquidity through April and May which will be a head wind for risk assets such as Bitcoin. As always, take a long-term view when trading Bitcoin and don’t get shaken out by the day to day moves. Keep this final chart in mind for some perspective…

Watch the full presentation with detailed explanations and discussion on our YouTube Channel here: https://www.youtube.com/watch?v=B4wE3MZwXH0
Until we return with more analysis next month, keep stacking those sats!
Joseph Brombal
Research and Analysis Manager
The Ainslie Group
x.com/Packin_Sats